Manual
Using Crover
Everything from the first part on the canvas to a summed response you can trust. Read it front to back or jump to a chapter.
1Getting started
Crover simulates passive loudspeaker crossovers in the browser, the way XSim does on Windows. You draw the circuit – amplifier, resistors, capacitors, coils and drivers – load your driver measurements, and the graph shows what the speaker will do. Every change is simulated immediately, on your computer.
Guest or account
You can start in two ways on the sign-in page:
- With an account – Google, GitHub or email and password. Your projects are stored in the cloud and available on every device.
- As a guest – Or just try it out without an account →. Crover creates a guest session for you; your projects are saved like any others. A banner in the editor reminds you that you are a guest.
Guests can use everything except sharing: to share a project or join someone else's, you need an account. To keep your guest work, choose Create account (banner, user menu or Settings → Account) and link Google, GitHub or an email address. Your projects and feedback move over to the new account. Already have an account? Sign in there instead (link below the form, or /login) – the guest's projects move into that account the same way.
Projects you kept only in this browser (cloud sync off) move with you too – they stay in this browser, now under your account. Turn cloud sync on to use them on other devices.
Projects
My Projects (/projects) shows your latest projects. From there you can create a New Project, import a .crover file or an XSim .dxo or open the example. View all lists every project with search, sorting, and a menu per project to Rename, Duplicate, Download as .crover or Delete. The number of parts shown for a project counts resistors, capacitors, coils, switches and drivers – not the amplifier and not ground symbols, so a new project has 0 parts. The numbers under Your workbench count the same way.
Recently deleted projects: Delete moves a project to Recently Deleted; a message at the bottom says so and offers Undo. Recently Deleted is the last tab on the all-projects page, after All, Synced and Local (the overview links to it while something is in it). Each project there shows how many days are left and where it lives – in the cloud or only in this browser. There you can Restore it or Delete for good (it asks first); after 30 days it is removed for good, with its history and versions. While a shared project waits there, nobody you shared it with can open it or sees it in their list – restoring brings it back for everyone. Leaving a project someone else shared with you is not a delete: it is gone from your list right away and the owner can invite you again. Projects that live only in this browser (cloud sync off) go to this browser's Recently Deleted with the same 30 days; they keep using browser storage until they are removed.
In the editor, the project name is the text field in the header – click and type to rename. There is no save button: every change is saved automatically. File → New Project starts an empty project right from the editor, the same as on the projects page (in the cloud with cloud sync on, otherwise only in this browser). File → Export as .crover gives you a file that contains the circuit and all driver measurements, for a backup or to pass on. File → Export BOM (CSV) exports a parts list of all resistors, capacitors and coils. File → Open Project… (⌘O / Ctrl+O) opens a .crover or .dxo file as a new project, just like the import on the projects page – the project you have open is never overwritten.
Importing XSim projects
Crover opens XSim projects directly: Import .crover / .dxo on the projects page or File → Open Project… in the editor takes a .dxo file and opens it as a new project. A .dxo carries the driver measurements inside it, so you need nothing else. Afterwards a short report lists what came over and what Crover handles differently.
What is taken over:
- The schematic at XSim's positions (scaled to Crover's parts), with XSim's names – R1, C2, L3, and the driver names (S1, S2 … when a driver has none). XSim connects by position; Crover draws one wire per connection.
- Resistors, capacitors and coils with their values (converted to Ω, µF and mH), the coil's DCR, the capacitor's ESR (both from XSim's ESR field, in Ω), and parts set to short or open. Parts of a circuit block become normal parts with the values stored in the file.
- The source as an ideal amplifier (0 Ω) at the same voltage: its power is Vrms² / 8, and Crover drives √(8 · P) – exactly XSim's level. An inverted source becomes inverted polarity on every driver, which gives the same sum and phase.
- Per driver: FRD and ZMA (through the normal import, so dense exports are thinned), polarity, the delay as acoustic offset (XSim stores it in seconds; Crover converts at its own 343 m/s, so the time stays exact – the mm value is 0.3 % below what XSim shows), Muted as mute and dB gain as level trim. Phase from Hilbert transform becomes the phase source Derived with XSim's extrapolation settings as the driver's tails (frequencies, slopes, Invert Hilbert phase, Hilbert Delay to add read as ms), otherwise Measured; Z Phase from Hilbert derives the impedance phase from |Z|, as XSim does.
- Drivers that are not connected in XSim (alternatives parked on the sheet) are imported without wires; a GND symbol that only sits on such a driver is left out, so no loose ground stays on the canvas.
Not taken over: text labels. The report names muted drivers, since they do not sound. With measured phase the timing comes from the measurement alone – an XSim delay on such a driver is not added on top. With Z Phase from Hilbert the impedance phase is derived within the driver's Hilbert frequencies, like XSim. Checked against XSim exports of a real 2-way: summed SPL within 0.3 dB up to 3 kHz and 0.7 dB up to 10 kHz (mean under 0.1 dB), system impedance within 1 % above 100 Hz.
The example project
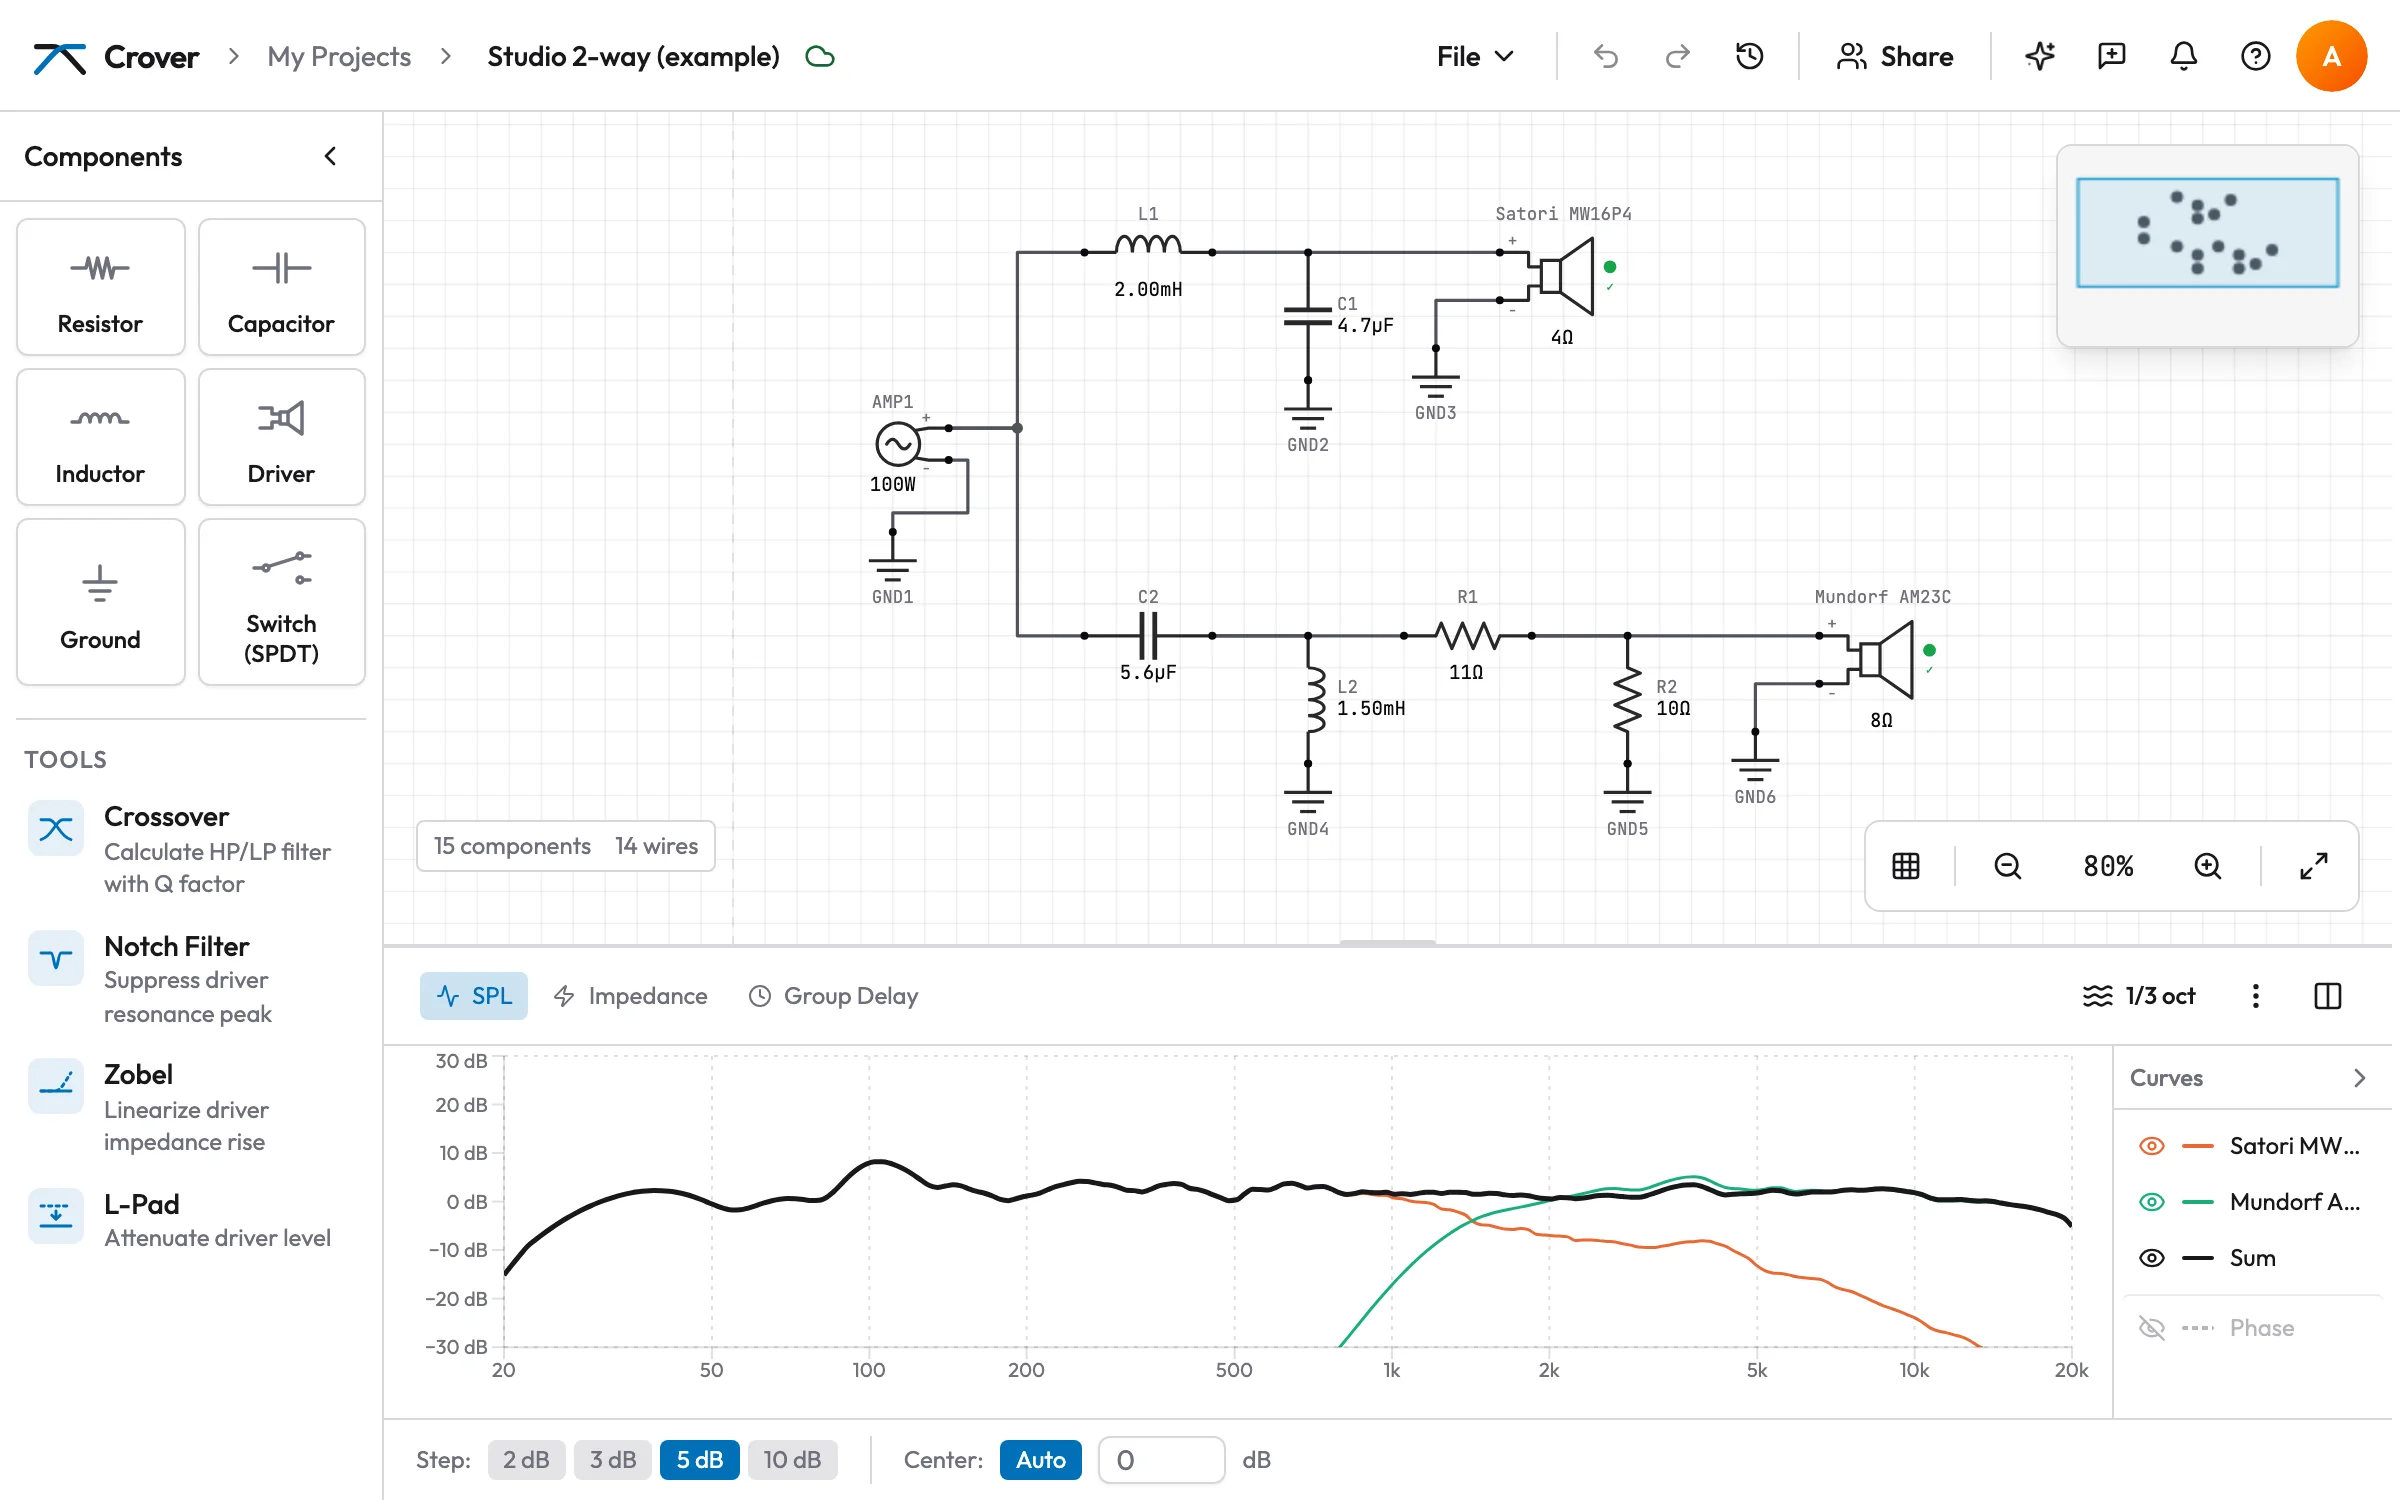
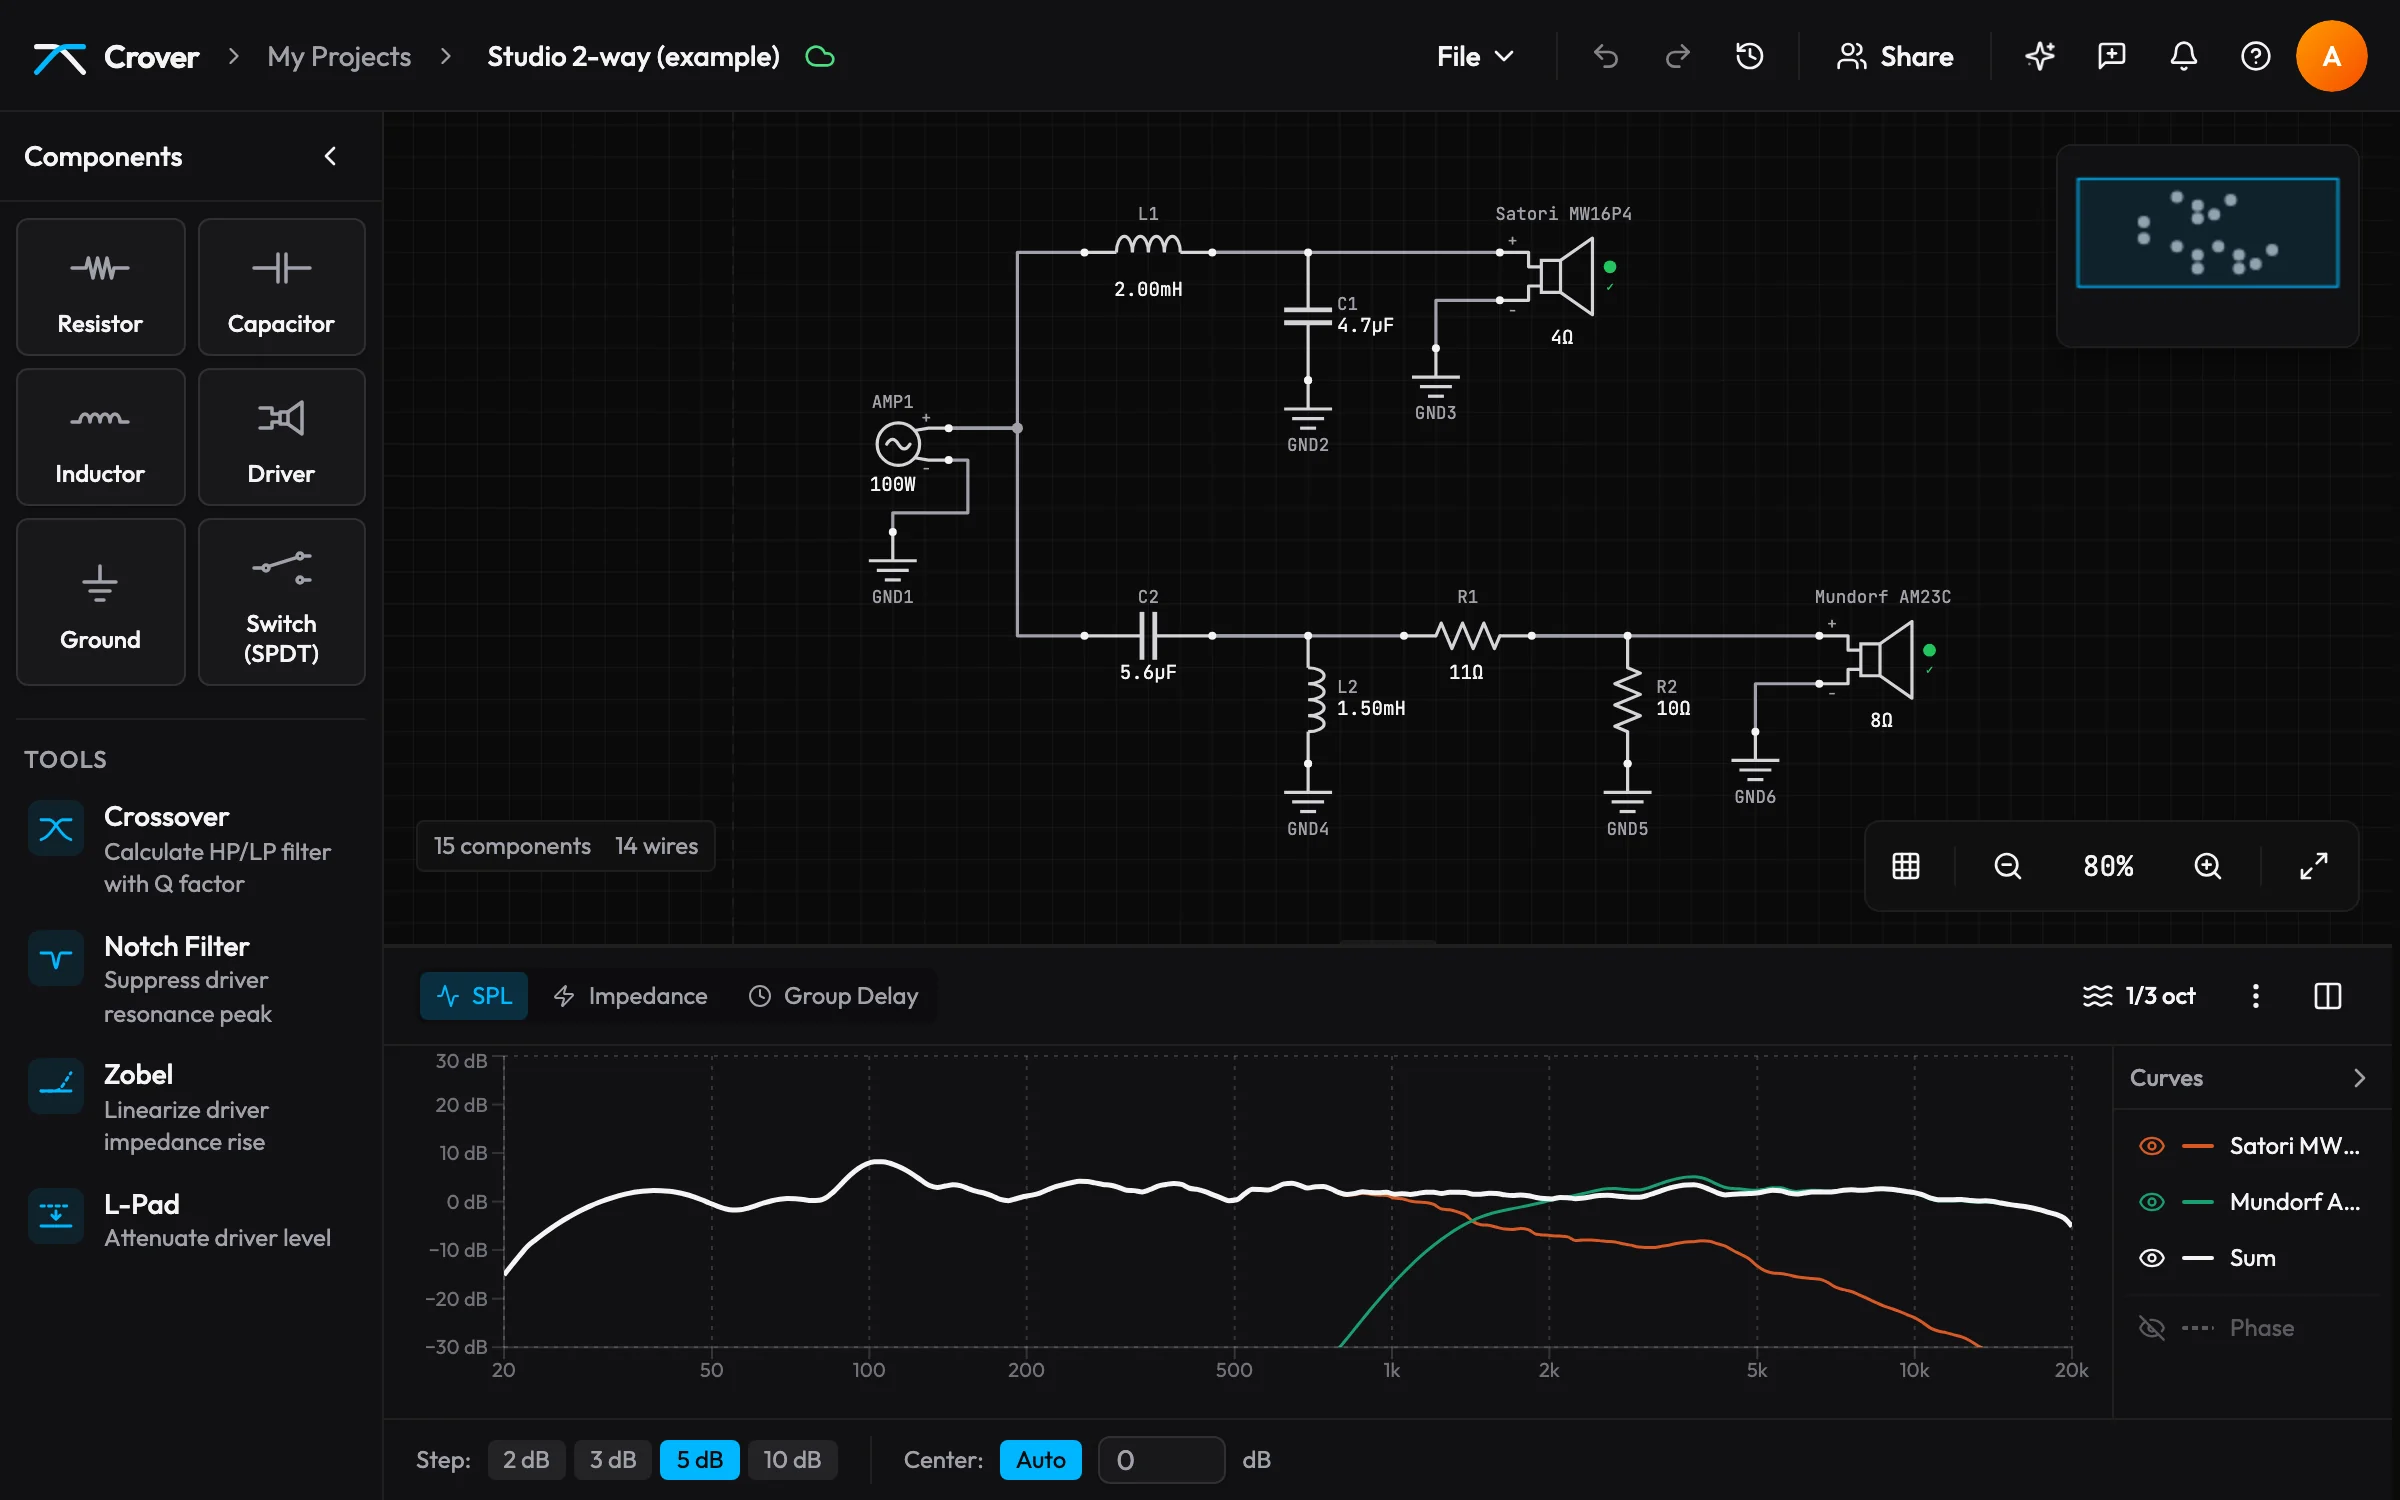
Open the example (on the start page and in My Projects) creates a copy of a real, measured 2-way speaker in your projects: a Satori MW16P4 woofer and a Mundorf AM23C tweeter, measured in the cabinet. It is your copy – change anything you like. It is the quickest way to see how a finished crossover looks in Crover.
Cloud sync on or off
Settings → Cloud → Sync projects live decides where your projects live. It is on by default and set per device.
- On: every change goes to the server straight away and appears on your other devices and for people you share the project with. Without a connection, changes are queued and sent later.
- Off: projects stay in this browser only, nothing is sent to the server. Sharing and project history are not available.
The cloud icon next to the project name shows the state:
| Icon | Meaning |
|---|---|
| green cloud – In sync | everything is on the server |
| amber cloud – Not in sync | changes are on their way |
| blue – Syncing… | connecting to the server |
| amber crossed cloud – Offline – not in sync | no connection; changes are kept and sent later |
| grey crossed cloud – Cloud sync off | this browser only |
| red cloud – Sync failed | syncing failed; your changes stay in the browser – reload the page to try again |
Even with sync on, the browser keeps a copy of the project, so you can keep working when the connection drops.
The browser keeps projects in its database, which has room for large measurement projects – usually hundreds of megabytes or more, depending on free disk space. If the browser still refuses (disk nearly full, or storage blocked, as in some private windows), a red Not saved in this browser appears next to the cloud icon. With cloud sync off the browser is the only copy – export the project (File → Export as .crover) and delete projects you no longer need (and Delete for good under Recently Deleted – until then they keep their space). With sync on the server still has every change while you are online; only the offline copy is missing.
With cloud sync off, Crover asks the browser once to keep its data even when space runs low (Firefox may ask you about it). Clearing the site data in the browser settings still deletes it – export projects you care about now and then.
Your first crossover in five steps
- Create a new project. It starts with an amplifier on the canvas.
- Add a driver and load its measurements (chapter 3).
- Add filter parts – a coil in series for a woofer's low-pass, a capacitor in series for a tweeter's high-pass – or let the crossover calculator place them for you.
- Wire amplifier → filter → driver and back to the amplifier's minus terminal (chapter 2).
- Read the graph (chapter 4) and tune values until the summed response is what you want.
No measurements yet, but a datasheet? Then plan the enclosure first and use its estimated curves for the first crossover – the tutorial “your first box” shows the way.
The Help button (?) in the editor has a short overview and can restart the interactive tour of the interface.
2Building a circuit
The canvas is your schematic. Parts sit on it, wires connect their terminals, and whatever is connected to the amplifier is simulated.
The parts
| Part | Value | Notes |
|---|---|---|
| Resistor | Ω (default 10) | level (L-pad), impedance correction, damping |
| Capacitor | µF (default 10), ESR in Ω (default 0) | in series: high-pass; across a driver: low-pass |
| Inductor | mH (default 1), DCR in Ω (default 0.5) | in series: low-pass; across a driver: high-pass |
| Driver | nominal impedance Ω (default 8) | your loudspeaker, with FRD/ZMA measurements (chapter 3) |
| Ground | – | the return path; all ground symbols are one net |
| Switch (SPDT) | position A or B | compare two branches, e.g. two tweeter pads |
The amplifier is not in the palette: every project has exactly one, and it cannot be deleted. Its Power in watts sets the signal level (chapter 4).
Coil DCR: real coils have resistance. Crover simulates it in series with the inductance, 0.5 Ω by default. Enter the value from the coil's datasheet – for a big woofer coil it can matter more than you think. 0 gives an ideal coil.
Capacitor ESR: the equivalent series resistance of a capacitor, simulated in series with the capacitance (Z = ESR + 1/(jωC)). It is 0 by default – an ideal capacitor, as in older projects. Film capacitors have about 0.01–0.1 Ω, electrolytics more; XSim uses 0.05 Ω. It lowers the depth of a notch or a Zobel a little and turns into heat in the part (Power per part).
Values can be typed freely. The ↑/↓ keys and the small arrows next to the field step through standard values (E24 for resistors, E12 for capacitors and coils), and a hint shows the nearest standard value. Number fields show the decimal separator of the app language (a point in English, a comma in German) and accept both when you type; in the other fields ↑/↓ change the value in small steps.
Placing parts
- Click or tap a part in the palette: it appears in the middle of the view, already selected – its properties open on the right.
- Drag it onto the canvas – with the mouse, a finger or the Apple Pencil – to put it exactly where you want. Drop it with a terminal right on another terminal and it connects. Drop a resistor, capacitor or coil onto a wire and it is inserted into that wire in series – the wire it will go into is highlighted while you drag. Where several wires lie on top of each other, the part is not inserted and a hint says Several wires here – drop it on a single wire: move it a little further along, to where only the wire you mean runs.
- Hold Shift while dragging to switch off snapping and auto-connect.
Parts snap to the grid and to each other (smart guides). Both can be set in the View menu (grid icon) next to the zoom buttons, bottom right.
Wiring
Every part has terminals – plus and minus (a switch has common, A and B; ground has one). An open terminal shows a ring, a connected one a filled dot.
- Put the pointer or your finger on a terminal – with a mouse the cursor becomes a crosshair. Terminals can be grabbed a little beside the dot, so they stay easy to hit when zoomed out. With a finger, terminals that sit close together (the amplifier’s + and −, a driver’s pair) each get the area on their own side, facing away from the part – touch just outside the part, a little above or below the middle.
- Drag to the terminal of another part. The dashed preview turns green when it will connect.
- Let go. The wire is routed automatically and follows the parts when you move them.
Several wires can meet at one terminal. Everything joined by wires forms one net. A wire always ends on a terminal, never in the middle of another wire – only the ends connect.
How wires are drawn. In the View menu under Wires you choose between Orthogonal (schematic) – horizontal and vertical runs, the default – and Straight (old look), a direct line from terminal to terminal as before the square routing – this old look will be removed in a future version. The choice is saved with your account (in the browser when you are not signed in); it only changes the drawing, never the circuit.
- Junction dots sit only where wires of the same net branch. Wires that cross without a dot are not connected there – the usual schematic convention.
- Wires of different nets never share a line: where their routes would lie on top of each other, one runs a few pixels beside the other.
- Highlight: point at a wire and exactly that wire lights up, with rings on its two ends – the piece a click selects and Delete removes. Point at a wired terminal to see its whole net instead – every wire, junction and terminal joined to it – while the rest fades back. A selected wire stays lit; on a touch screen, tap a wire.
To delete a wire, click or tap it and press ⌫ or Delete wire in the action bar, or open its context menu → Delete. Deleting a part also deletes its wires.
Selecting and editing
The context menu of a part or wire opens with a right-click – or, on a touch screen, by holding it for half a second. Whenever something is selected, the action bar top left of the canvas offers the everyday actions as buttons: rotate, duplicate, polarity (drivers), A/B (switches), short and open (R, C, L), delete, and More actions (⋯) for the full context menu. The letters next to the menu entries work while it is open too: R, S, O … run the entry and close the menu.
- Select: click or tap a part. Shift+click adds or removes parts. Drag on empty canvas to draw a selection box – with the mouse or the Apple Pencil; with a finger, first switch on Select with finger (dashed square in the zoom bar). Parts placed together by a tool are selected as a group; Ungroup in the context menu separates them.
- Move: drag. With several parts selected, they move together. A second finger during a drag cancels it – everything goes back and the view pinches instead.
- Rotate: R, the action bar or the context menu → Rotate 90°.
- Duplicate: ⌘⇧D. Copies keep their values but not their wires. Clone Driver (with FRD/ZMA) copies a driver including its measurements.
- Delete: ⌫, the action bar or the context menu → Delete.
- Undo/redo: ⌘Z / ⌘⇧Z, or the arrows in the header. Dragging a slider or a part is one step.
Keyboard actions such as R or ⌫ apply to the part under the pointer first, and to the selection otherwise.
Short, open and switches
To hear – well, see – what a single part does, take it out temporarily instead of deleting it. Select a resistor, capacitor or coil and use the action bar, or open its context menu:
- Short (Bypass) (S) – replaced by a wire; drawn with a diagonal line.
- Open (Disconnect) (O) – removed from the circuit; drawn faded with a dashed red outline.
- Normal (N) – back in the circuit. Pressing S or O again also returns to normal.
A switch connects its common terminal to A or B (B, the action bar, the context menu or Throw A / Throw B in the properties). Build two versions of a branch, put a switch in front, and flip between them to compare.
Zoom and pan
A project that does not fit the view when you open it (like the example on a smaller screen) is zoomed to fit – never above 100 %, so a small circuit keeps its normal size.
| Device | Pan | Zoom |
|---|---|---|
| Mouse | wheel, middle button drag, Space+drag or Alt+drag | ⌘/Ctrl + wheel |
| Trackpad | two-finger scroll | pinch – the zoom follows how far your fingers move (Safari too) |
| Touch (iPad) | one finger on empty canvas (not while Select with finger is on), or two fingers; flick and the view glides on | pinch – also when it starts on a part |
The buttons bottom right zoom in and out and Zoom to fit shows the whole circuit. The minimap top right shows where you are; click, tap or drag in it to move the view. Zoom goes from 10 % to 500 %: pinch or scroll past either end and the view gives a little, then springs back when you let go (with reduced motion it simply stops).
On an iPad or touch screen
- Tap selects, tap on empty canvas deselects, holding for half a second opens the context menu.
- One finger drags parts and wires and pans on empty canvas; two fingers always pan and zoom.
- Several parts: switch on Select with finger in the zoom bar and draw a box with one finger. The Apple Pencil always draws a selection box on empty canvas – finger pans, pencil selects.
- Palette: tap a part to add it in the middle of the view, or drag it sideways onto the canvas; swiping up and down scrolls the palette.
- In portrait the palette starts as a narrow icon bar, so the canvas keeps its room next to the properties. It holds the parts and, below a line, the tools (crossover, notch, Zobel, L-pad): tap to open, drag onto a driver.
- In portrait the properties, the assistant and the tools slide in from the right over the canvas instead of making it narrower; the chart below stays fully visible, so you can change a value and watch the curves. The panel opens when you tap a part or a tab and goes away with its close button, a tap on empty canvas, or a swipe to the right on its title bar. In landscape it sits beside the canvas as on a computer.
Keyboard shortcuts
⌘ on a Mac is Ctrl on Windows and Linux. Many shortcuts can be changed in Settings → Keyboard.
| Keys | Action |
|---|---|
| ⌘Z / Ctrl+Z | Undo |
| ⌘⇧Z / Ctrl+Shift+Z (or Ctrl+Y) | Redo |
| ⌫ / Del | Delete the part under the cursor, or the selection |
| R | Rotate |
| ⌘⇧D / Ctrl+Shift+D | Duplicate the selection |
| ⌘C / ⌘V | Copy / paste parts (within Crover) |
| ⌘A / Ctrl+A | Select all |
| Esc | Deselect, close a menu |
| I | Invert a driver's polarity |
| S / O / N | Short / open / normal state of R, C or L |
| B | Flip a switch between A and B |
| T | Open the properties panel |
| ⌘⇧A / Ctrl+Shift+A | Open the assistant |
| ⌘S / Ctrl+S | Save and sync now (it also happens automatically) |
| ⌘O / Ctrl+O | Open a .crover or XSim .dxo file as a new project (File → Open Project…) – the open project stays as it is |
| 0 | Zoom to fit the whole circuit |
| ? | Open the help panel |
| Space + drag | Pan the view |
3Drivers and measurements
A simulation is only as good as the driver data behind it. Crover works with the two file types every measurement program exports: FRD (frequency response) and ZMA (impedance).
How to get these files is shown in the guides Create FRD and ZMA files and Measure impedance with REW.
File formats
Both are plain text with one frequency per line:
* FRD: frequency (Hz)  SPL (dB)  phase (°)
20      78.4    152.1
21.2    79.0    148.7
...

* ZMA: frequency (Hz)  impedance (Ω)  phase (°)
20      9.8     21.4
...- Separators: tab, comma, semicolon or spaces – detected automatically.
- Lines starting with
*,#,;,!or//are comments; text header lines are skipped. - The phase column is optional. Degrees or radians are recognised from the values.
- A decimal comma (
85,3) works as long as the columns are separated by tabs, semicolons or spaces. With comma-separated columns use a decimal point (85.3).
Importing measurements
Select a driver and click Add measurement data… in the Driver Data section of the properties panel. Quicker: drag files, a folder or a ZIP from your computer straight onto the driver on the canvas – the driver lights up under the pointer, and the Add data dialog opens with the files already in place (FRD and ZMA are told apart as below). Dropped next to a driver, you pick the driver in the dialog. Every way in and every format: Getting data into Crover.
- Files – drop the FRD and (optionally) the ZMA, or choose them.
.frdand.zmaare assigned by extension,.txtfiles by their header and values. Each file shows what Crover recognised in it and why, and where it goes; a second FRD stays visible as “not imported” until you choose which one counts. If an “FRD” looks like impedance data, the report warns. Very dense files (e.g. REW exports with linear spacing, tens of thousands of lines) are reduced to at most 1/96 octave – the slot says from how many to how many points. The simulated response of a gated measurement changes by less than 0.05 dB, and the project fits in the browser again (the report gives the point counts). Only files that really are that dense are reduced: exports at 1/96 octave or coarser and hand-digitized curves with irregular spacing stay exactly as they are.
If the phase of such a dense file holds a delay of more than 25 ms – not a distance to the microphone but a wrong time reference in the measurement software (REW: the capture start or a loopback with the interface latency, often fractions of a second or whole seconds) – Crover takes it out of the phase before reducing the points, which would otherwise turn it into noise. The report then says, e.g., “Removed a time offset of −0.70 s from the phase”. REW may show a different number for the same measurement, e.g. Delay 4757 ms: on a file with evenly spaced frequencies the phase only shows the delay modulo 1 ÷ frequency step – with REW's step of 0.366 Hz (e.g. 48 kHz, 128k FFT) delays 2.73 s apart turn the phase identically (4.757 s − 2 × 2.73 s = −0.70 s), and Crover names the smallest of them. It is the same offset; nothing is wrong with either number. The phase then no longer holds this driver's timing either, so the driver is set to the phase derived from the magnitude, and its acoustic offset works: set it to place the driver relative to the others. The corrected file phase stays stored – switching back to Measured plays it, without any timing. Delays up to 25 ms are real acoustic timing and stay in the phase. Values are stored at 0.001 dB, 0.1 mΩ and 0.01°, far finer than any measurement. - Check – previews of SPL, phase and impedance. Here you choose whether to keep the file's phase or Derive minimum phase from magnitude (files without phase always get the derived phase), plus polarity and nominal impedance (pre-filled from the ZMA).
- Report – what will be imported, every note in one list, and what depended on the old FRD (see Replacing a measurement). Then Apply – one step to undo.
What you don't load again stays, so you can replace just one file – an inverted driver stays inverted unless you change it here.
The Load / Replace buttons next to FRD and ZMA open the same dialog; a single, clear file jumps straight to the report – with the same checks as any import.
Measured or derived phase
Every driver has a Phase source: Measured or Derived. The difference matters as soon as two drivers play together (chapter 5).
- Measured (green): the phase comes from your measurement. If it was taken with a timing reference (dual channel or loopback) at the listening position, it already contains the real acoustic timing of the driver – how much later its sound arrives than the others'.
- Derived (amber): Crover calculates the minimum phase from the SPL curve. That is correct in shape, but it knows nothing about where the driver sits. You have to add the timing yourself with the acoustic offset.
The import sets the phase source for you: measured if the file had phase and you kept it, derived otherwise. The switch in the driver properties changes it at any time: Derived calculates the minimum phase from the SPL curve and adds the offset, Measured uses the file's phase again. The measured phase is kept, so you can switch back and forth safely.
Tails beyond the data (derived phase)
The minimum phase depends on how the magnitude goes on outside the measured band. By default Crover continues the slope at each band edge (a roll-off of at most 36 dB/oct). With derived phase the driver properties show Tails beyond the data; switch on Custom to set it yourself, like XSim's Hilbert settings: Below / Above a frequency the data is replaced by a tail with the given slope in dB/oct (0 = flat) – the simulation plays that tail too. Invert phase and Extra delay exist for XSim projects. An XSim import fills these in from the .dxo; switching Custom off goes back to the automatic tails.
Acoustic offset
The Acoustic Offset in mm says how far the driver's acoustic centre sits behind (or in front of) the others. Positive = further from the listener = its sound arrives later; negative = closer. A typical example: a woofer's acoustic centre sits deeper in the cone than a dome tweeter's, so the woofer gets a positive offset of a few centimetres relative to the tweeter.
The offset is turned into a delay (1 mm ≈ 2.9 µs at 343 m/s) and applied to the driver's phase. It is only used with derived phase. With measured phase the field is disabled – the timing is already in the data.
With derived phase and offset 0 the panel reminds you that there is no real timing yet. Change the offset until the dip at the crossover disappears or the sum matches a measurement of both drivers together.
Polarity
Inverting a driver adds 180° to its phase – like swapping its wires. Use the polarity button in the action bar, the context menu (Invert Polarity), the shortcut I or the import dialog. An inverted driver shows a red Ø on the canvas. A driver wired the other way round (plus to ground) plays inverted too.
Mute and level trim
- Mute (driver properties) takes a driver out of the summed response – to look at the woofer alone, say. It stays in the circuit: the impedance, the currents, the power and the other drivers' curves are the same as unmuted, exactly like Muted in XSim. The canvas shows it faded with an amber slash; the graph draws its curve dotted and faint with muted in the legend, so you still see what it would add. The assistant, its response summary and the optimizer leave it out of the sum too.
- Level trim adds a fixed number of dB to the driver's SPL before the sum, the phase stays – an ideal level change like XSim's dB gain (negative = quieter). It also lifts the flat 70 dB stand-in of a driver without FRD. A trimmed driver shows it next to its impedance on the canvas (
8Ω −2dB) and in the legend (level −2 dB). It does not change the circuit: to really lower a tweeter, use an L-pad (chapter 6).
Nominal impedance and missing files
- Estimate from the ZMA: Crover takes the lowest |Z| above the resonance peak (the plateau before the voice-coil inductance lifts the curve) and picks the largest of 2, 3, 4, 6, 8 or 16 Ω that this minimum does not undercut by more than 20 % (IEC 60268-5). A ZMA that starts above the tweeter's resonance uses its overall minimum. Drivers whose minimum dips further than the standard allows come out one step lower – check the value against the data sheet and correct it if needed.
- No ZMA: the driver is simulated as a plain resistor with its nominal impedance (the Impedance value, e.g. 8 Ω). Real drivers are not resistors – filters designed this way behave differently with the real impedance peak and rising voice-coil inductance. Load a ZMA whenever you can.
- ZMA without phase: Crover derives the minimum phase from |Z|, which is accurate for normal driver impedance curves.
- No FRD: like XSim, the driver is simulated with a flat 70 dB response at 2.83 V and still counts in the sum. Its curve is marked flat · no FRD in the legend. It shows the electrical effect of the filter only, not how the driver sounds.
The small dot on the driver symbol tells you what is loaded: ✓ both files, ! FRD only, × no FRD.
If the driver has T/S and an enclosure, an estimate can play instead of the flat stand-in: switch on Use curves from the enclosure in its properties. The symbol then shows a neutral ≈ instead of the ×. See Curves from the enclosure.
4Getting data into Crover
Measurements, angle sets, driver parameters and whole projects reach Crover one way: the Add data dialog. It opens wherever data belongs and knows what fits there:
- in the driver panel under Driver Data (Add measurement data…, Load, Replace) – everything for this driver,
- when you drag files, a folder or a ZIP onto a driver on the canvas – the same,
- when you drag them onto the free canvas – you pick the driver (or a new one); a project opens as a new project,
- through File › Add Data… – everything, also for several drivers at once.
What goes where
- FRD (frequency response) and ZMA (impedance) belong to a driver – one each. How and where to measure: Importing measurements and Measured or derived phase.
- Projects (
.crover, XSim.dxo) always open as a new project – a file never overwrites the open one. - T/S parameters (WinISD
.wdr) belong to a driver; a WinISD project (.wpr) brings box and drivers into this project.
Supported files and sources
| File | Source | Gives | Note |
|---|---|---|---|
.frd | Measurement files (REW, ARTA, DATS, VituixCAD …) | FRD | – |
.zma | Measurement files (REW, ARTA, DATS, VituixCAD …) | ZMA | – |
.txt | Measurement files (REW, ARTA, DATS, VituixCAD …) | FRD, ZMA | FRD or ZMA by header and values |
.csv | Measurement files (REW, ARTA, DATS, VituixCAD …) | FRD, ZMA | FRD or ZMA by header and values |
.dat | Measurement files (REW, ARTA, DATS, VituixCAD …) | FRD, ZMA | FRD or ZMA by header and values |
.zip | Measurement files (REW, ARTA, DATS, VituixCAD …) | FRD, ZMA | unpacked one level deep – folders too |
.dxo | XSim | project | opens as a new project |
.crover | Crover | project | opens as a new project |
.wdr | WinISD | T/S | T/S of one chassis |
.wpr | WinISD | project | box and chassis into this project |
.pdf | Datasheet (PDF) | T/S | T/S read from the text, checked by you |
| live | REW live (Room EQ Wizard ≥ 5.40) | FRD, ZMA | straight from the running REW, unsmoothed; not in Safari |
The dialog
- Files – each file shows what Crover recognised in it (frequency response, impedance …), why (extension, header, values) and where it goes. What does not fit here is listed under Doesn't fit here with the reason and the right place. A second FRD for the same driver stays visible as “not imported” until you choose which one counts. Nothing disappears silently.
- Check – preview, phase from the file or derived, polarity, nominal impedance and where the FRD was measured.
- Report – what will be imported and every note in one list (smoothed, time offset removed, reduced, looks like impedance …). Apply is a single step to undo – also for several and for new drivers.
Replacing a measurement
When you replace an FRD, the report shows what depended on the old one. The tails beyond the data (Hilbert tails) are reset by default – they replace the data outside their band and would silently cut a new measurement with another band; a tick keeps them. The place of measurement starts at In its cabinet again for the new file (change it in the Check step); “Add the low end from the enclosure below … Hz” stays.
Where a curve came from
Crover keeps, per curve, where it came from: the way (file …), the program from the header (e.g. REW V5.31.3, DATS), the measurement's name, the date, the smoothing, the timing reference (loopback, acoustic, none), whether the file had a phase and whether a time offset was removed. The driver panel shows it as one line under FRD and ZMA (amber when smoothed; everything in the tooltip), the legend names the program and the assistant gets it as context. A project's public page shows only the way, the program and the place of measurement – no file names, titles or dates. Curves in older projects have no origin; nothing about them changes.
Measurement files (REW, ARTA, DATS, VituixCAD …)
Text with one frequency per line (see File formats). Crover reads the header lines too: REW writes program, date, smoothing, name and timing reference there, DATS its name; column headings like Z(Ohms) give away an impedance file even without its extension. Export unsmoothed for the crossover – the report warns about smoothed data.
REW live
With REW 5.40 or newer running on the same computer, Crover reads its measurements directly – no export. In Add data choose From REW, then Connect to REW:
- In REW switch on Preferences › API › Start the API when REW starts (or start REW with
-api). REW listens on port 4735; if you started it with another-port, enter that port next to the button. - Chrome, Edge and Firefox ask once whether this page may access apps on this device – allow it, that is how the page reaches REW. Blocked by mistake: lock icon next to the address › site settings › allow local network access.
- Safari (and every browser on iPhone/iPad) does not let a web page reach REW. There: in REW File › Export › Export measurement as text, without smoothing, and drop the files under Files.
The list shows every REW measurement with its name, kind (SPL or impedance), date and timing reference. Crover reads the chosen ones unsmoothed on REW's own frequency grid – dense enough to find and remove a loopback latency – and from there on they are treated like files: an SPL measurement becomes an FRD, an impedance measurement a ZMA. The origin says REW 5.40 …, the measurement's name, date and timing reference. Crover only reads; nothing in REW changes.
Folders and ZIP
A folder or ZIP (say a manufacturer's data package with FRD, ZMA, PDFs and texts) is unpacked one level deep. Every file is listed: measurements with their place, PDFs and images as “not a data file”, a ZIP inside the ZIP as a note. Subfolders and names say which driver a file belongs to.
Datasheet curves
Digitised curves (WebPlotDigitizer, SPL-Trace) have irregular spacing and no phase: Crover takes them as they are and derives the minimum phase. Choose Datasheet curve in the Check step and the enclosure model adds the low end.
XSim (.dxo)
An XSim project opens as a new project with schematic, drivers and measurements – details in Importing XSim projects.
Crover (.crover)
An exported Crover file opens as a new project, with all curves and their origin.
WinISD (.wdr, .wpr)
A .wdr brings a driver's T/S parameters – together with its FRD and ZMA in one step. A .wpr brings box and drivers into this project (through File › Add Data… or in the enclosure planner) and replaces the active box.
Datasheet (PDF)
Drop a manufacturer's datasheet onto a chassis (or into the planner): Crover reads its text on the server and shows every value it found with unit and a check mark – confirmed when it fits the other values (fs to Mms and Cms, Vas to Cms and Sd, Qts to Qes and Qms), to check when it needed an assumption, a contradiction when it does not fit. Click a value to see where it stands in the sheet. Sheets with several versions (4 Ω / 8 Ω, coax woofer and tweeter) let you pick yours; Xmax printed peak to peak is halved – switch it if the sheet means one way. If the sheet does not say what kind of driver it is, Crover estimates it from the values – check it. The PDF is not kept, only the values: the file name and where each value stands stay in your project – in the T/S table a mark next to each value shows where it came from (or that you changed it) and whether it fits the others. A scan or a sheet whose fonts carry no characters is read with text recognition (OCR). Crover uses no AI for this (that keeps it free): on normal PDFs nearly every value comes out right, on scans about 4 in 5 – every value read by text recognition is marked „please check“ until it fits the others, so compare it with the sheet. If OCR finds nothing, paste the text under Add T/S… › From a datasheet; on a Mac or iPhone you can copy the text straight out of the PDF image (Live Text). In the enclosure planner the same way takes the PDF too. A datasheet may be up to 10 MB, the first 12 pages are read (with OCR the first 4); Crover reads 50 new datasheets a day per account (10 as a guest) – a sheet read before does not count.
T/S from measurement
In the enclosure planner, Add T/S… › From your own measurement leads in four steps to Re, fs, Qms, Qes, the voice coil and Vas – more precise than a datasheet, but it needs an impedance jig and a free-air measurement. Every step has one main action (Next); Back works at any time.
- Choose the measurement: File (.zma or text export), From REW (connecting, the port and the note on the browser permission appear only here) or This chassis' ZMA. The stored ZMA can only be chosen when it looks like free air – a crossover project's ZMA is usually measured in the box: “Measured in the box – right for the crossover, not suited for T/S”. How do I measure correctly? opens the instructions: driver out of the box, hanging free, away from walls, small level (about 0.3 V), from well below fs (about 5 Hz) – then Re comes from the low end.
- Check: the fitted values, the fit's deviation and measured against model in a chart. Crover tries two voice-coil models (LR-2 and the semi-inductance of real coils) and keeps the closer one. When the curve looks like a box – two impedance peaks below about 300 Hz with a dip between them (vented), a resonance far above the datasheet's fs (sealed) or an unusually damped peak – Crover warns “This looks like a measurement in a box” and says what to do. It only goes on after Use it anyway.
- Vas: choose the method first – Keep the datasheet's Vas (preselected when the chassis has one), Added mass (fs drops; needs Sd), Test box (closed box of known volume, fs rises) or By hand. Then only the fields that method needs show; the second measurement is asked for only with added mass and test box (the same three sources, the same check – for the test box only for a vented box).
- Overview: every value before → new, marked from measurement; what is beyond the usual sample spread to the datasheet is highlighted. Use these T/S replaces Re, fs, Q, Le, Vas and the mechanics in one undo step; Sd, Xmax, power and size stay. In the T/S table the values then show own measurement as their origin (with the file or REW).
REW computes its own T/S values in its impedance window but does not hand them out through its interface (API 0.9.8) – so Crover fits the curve itself.
When something does not work
Crover does not take a file. It is listed under Doesn't fit here with the reason – often the wrong place (a project in the driver panel) or no data rows.
A ZIP with 30 files – which does Crover take? One FRD and one ZMA per driver (extension before header before values); the rest is listed as “not imported” and can be switched.
REW: “REW does not answer”. REW 5.40 or newer running? API switched on (Preferences › API)? Did the browser ask about apps on this device – and was it allowed? In Safari it cannot work; export as text instead.
5The simulation
Crover re-simulates the circuit a moment after every change, in your browser. The result is the graph at the bottom of the editor.
How Crover simulates
- Every circuit is solved with nodal analysis (MNA), the method SPICE uses – series, parallel, bridged, 3-way, anything you can wire.
- 200 frequencies from 20 Hz to 20 kHz, spaced logarithmically. Measurement data outside its range is held at its first/last value.
- Parts are ideal except for the coil DCR and a capacitor's ESR (0 unless you enter one). The amplifier is an ideal voltage source (0 Ω output impedance).
- Drivers are loaded with their measured impedance (ZMA), their acoustic outputs are added as complex values – magnitude and phase – into the summed response.
- A driver plays if it sits in a closed loop with the amplifier. A driver that is wired the wrong way round still plays, just inverted.
Amplifier power and level
The amplifier's power sets the voltage: U = √(P · 8 Ω). 1 W gives 2.83 V – the voltage FRD files are usually measured at – and 100 W (the default) gives 28.3 V, i.e. 20 dB more. The SPL curves move up and down with it; the shape stays the same. The power also drives the part power estimates (below).
In the enclosure planner the amplifier power is also the default reference level for excursion and port air. So set it to what you really listen at before you let Crover plan a box.
The graph
- SPL – each driver after its filter, plus the Sum. The Phase toggle in the legend adds every driver's phase (dashed) and the sum's phase.
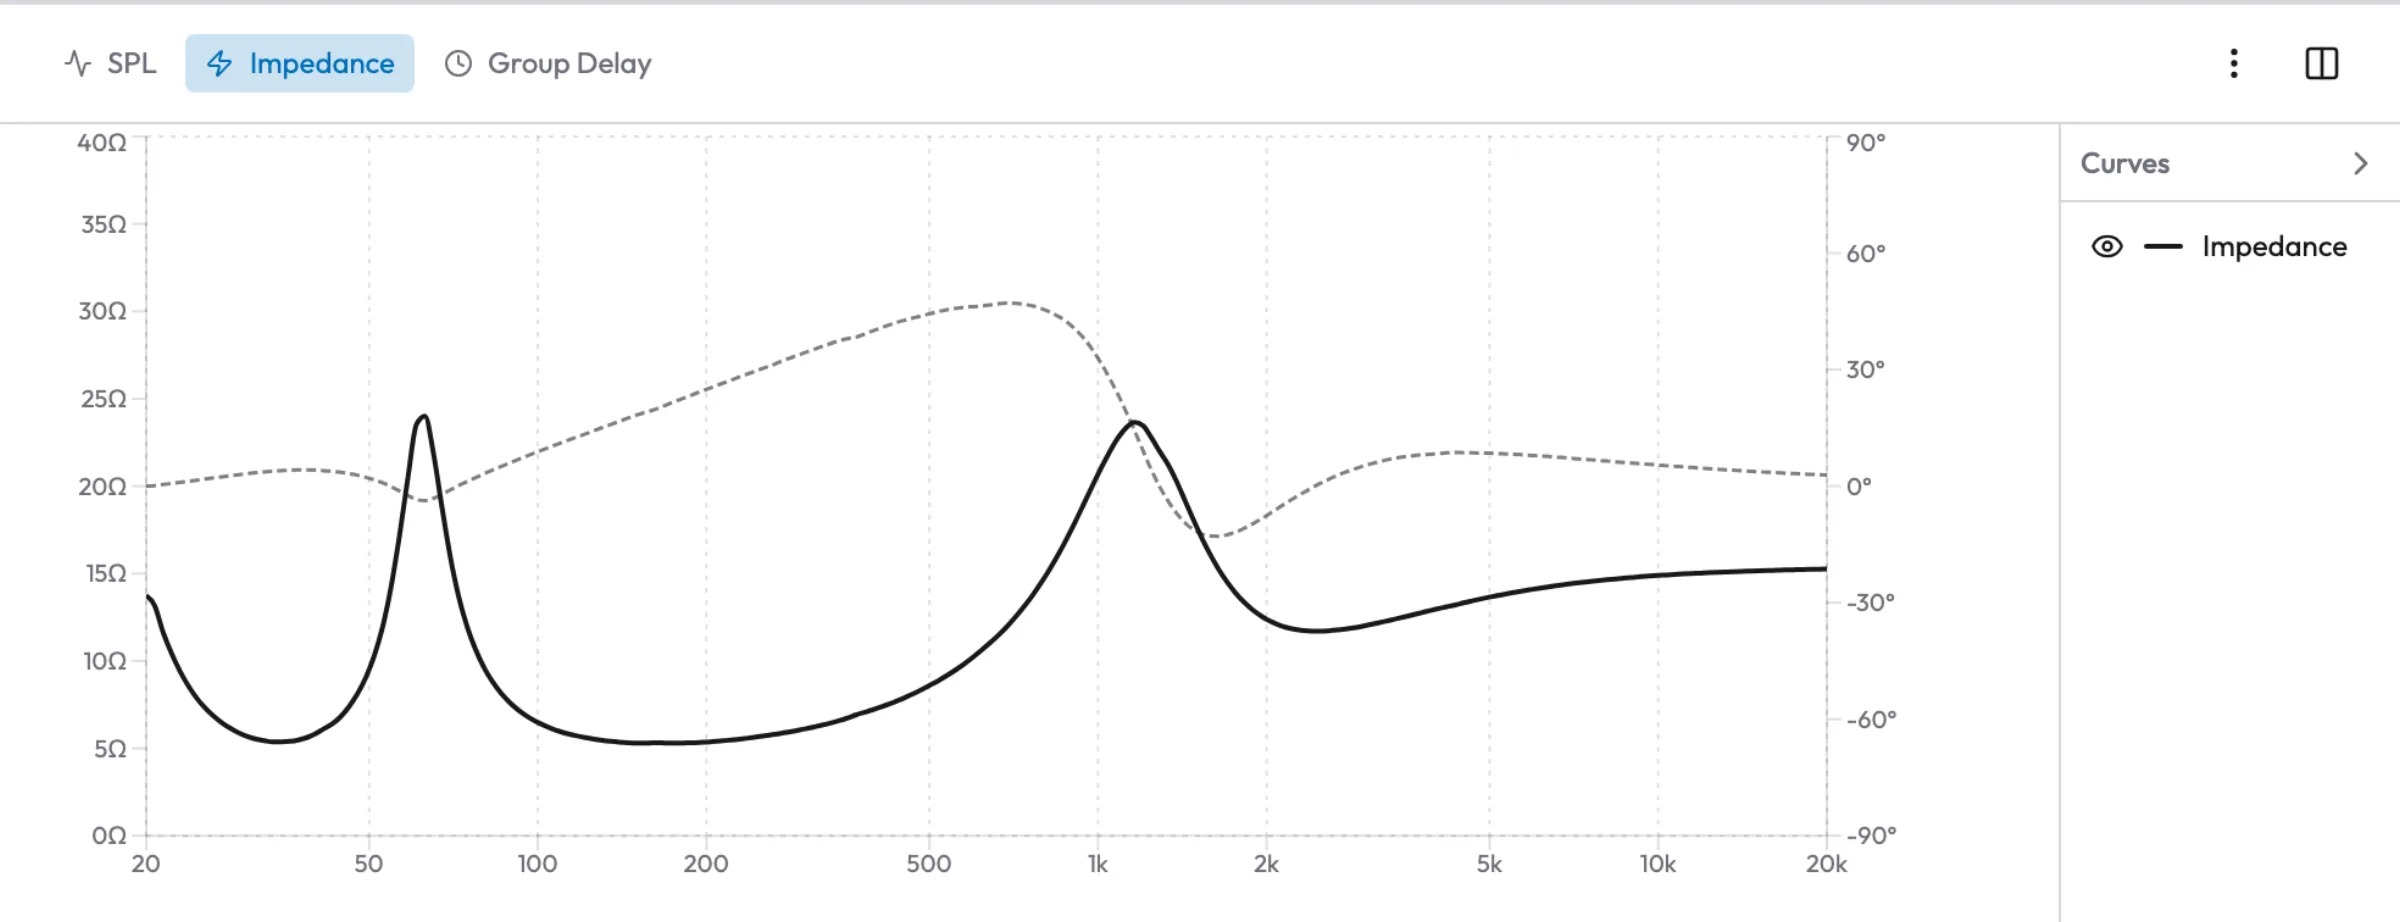
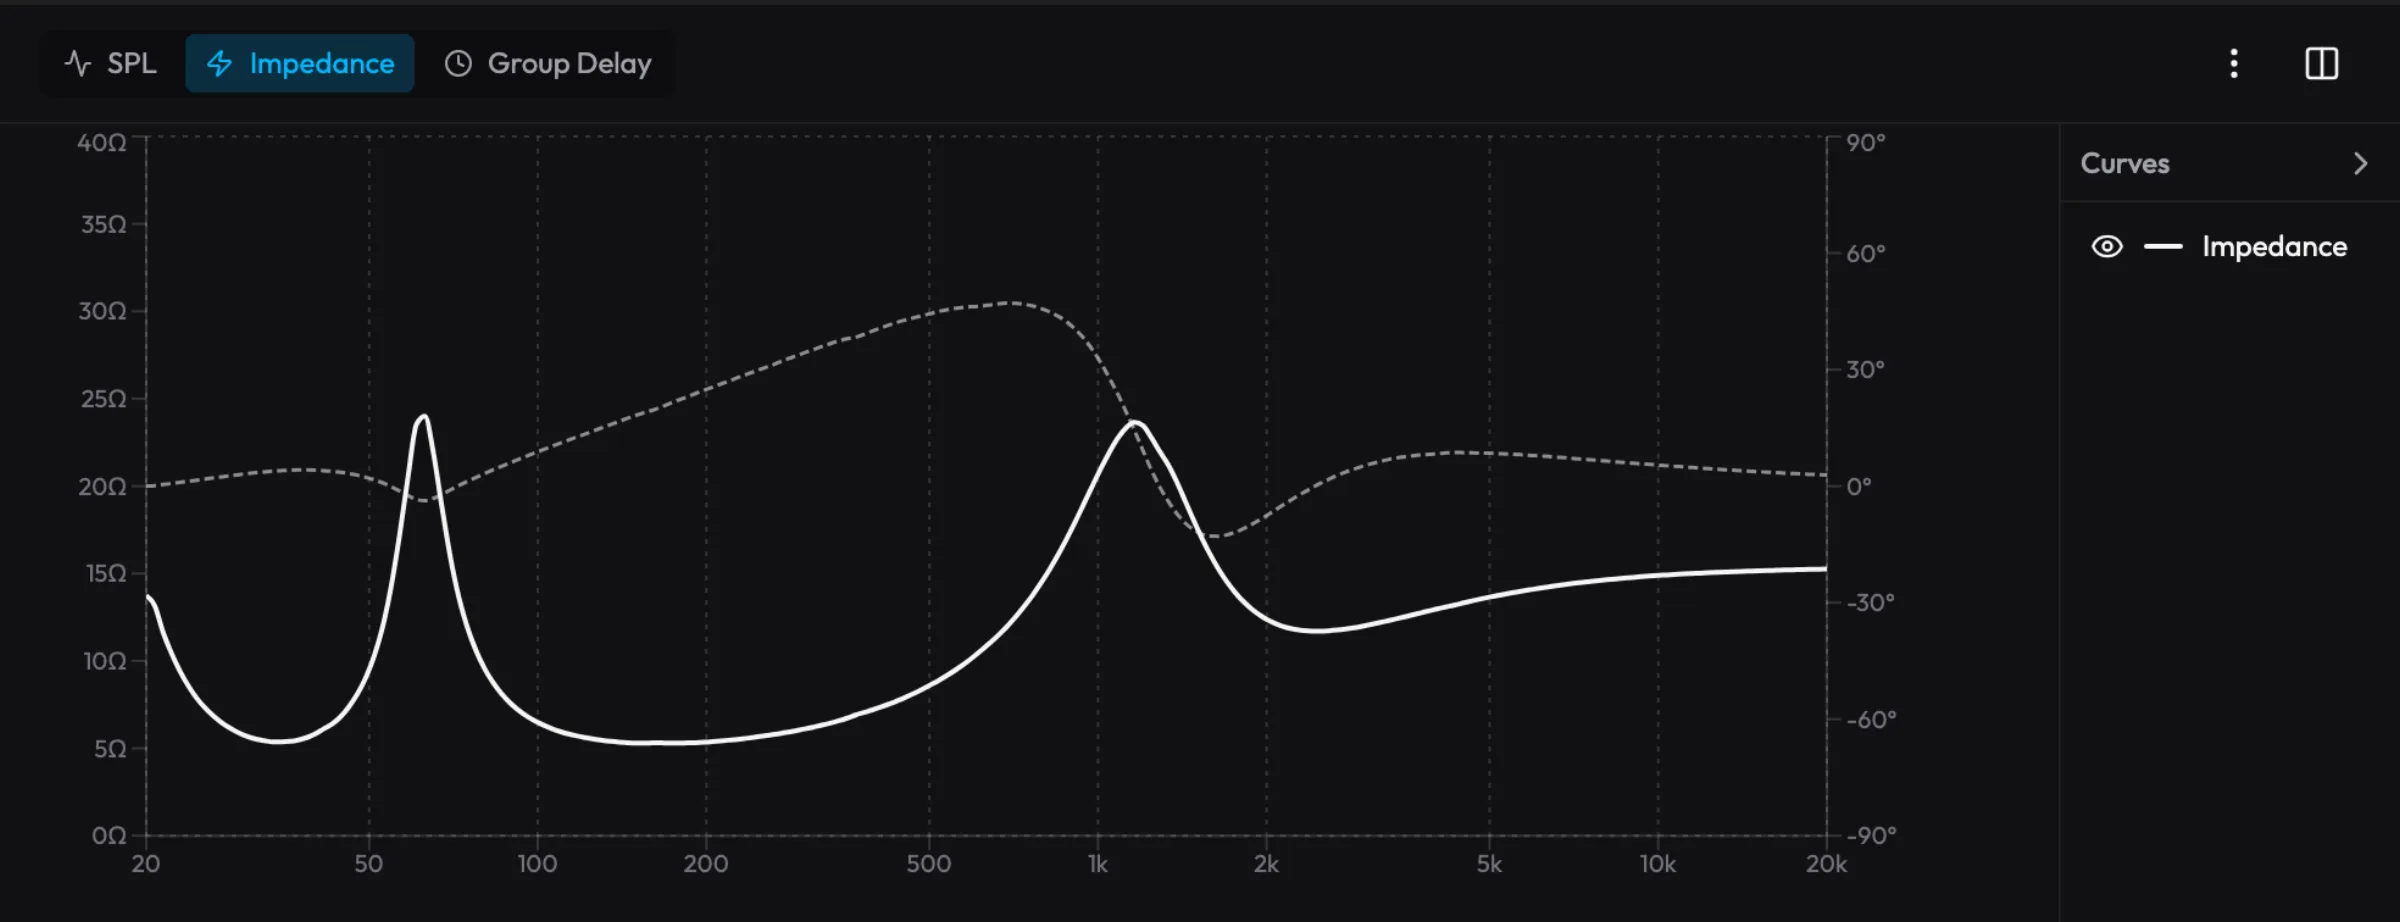
- Impedance – what the amplifier sees: |Z| and its phase. Watch the minimum – below about 3 Ω many amplifiers struggle, and Crover warns.
- Group delay – in milliseconds, see chapter 5.
- Electrical, Part V/I/P and Impulse/Step – see below.
Click a legend entry to hide or show that curve. Split View shows two graphs side by side. Hover to read exact values. The footer sets the dB per grid step and where the scale is centred (Auto follows the sum).
Smoothing
Measurements are ragged; smoothing makes the trend readable. Choose Unsmoothed, 1/24, 1/12, 1/6 or 1/3 octave (default) in the graph menu. It applies to SPL and group delay, never to impedance.
Reference curves and export
- Import Reference (graph menu, SPL view) overlays a measured FRD as a dashed curve – for example a measurement of the finished speaker, to compare simulation and reality. If the file holds no readable frequency/SPL columns, a message under the header says so.
- Export as PNG saves the graph. Export as FRD (SPL view) saves the summed response with phase, Export as ZMA (impedance view) the system impedance, and Copy Data puts the numbers on the clipboard. The FRD export uses the smoothing you see.
Electrical, part and time views
- Electrical – per driver the voltage at its terminals relative to the amplifier, in dB (0 dB = the full amplifier voltage), straight from the circuit solver. No FRD, level trim or amplifier power is in it: it is the crossover alone, like XSim's electrical response. The Phase toggle adds its phase; a driver wired the wrong way round reads 180° off. The Phase toggle is shared with the SPL graph.
- Part V/I/P – select a resistor, capacitor, coil or driver on the canvas: the graph shows its RMS voltage, current or power (switch below the graph) over frequency, driven by a sine at the amplifier's power (
U = √(P · 8 Ω), the same as the SPL). Power is heat in a resistor, in a coil's DCR and a capacitor's ESR, and the electrical power a driver takes in. The legend names the maximum; a resistor's power rating is marked as a dashed line when it is near the curve, and the note turns amber when the curve goes above it. Nothing or an amplifier/ground selected: the graph says what to select. - Impulse/Step – the summed response (white) and each driver in the sum, as impulse or step response, computed from the complex response by an inverse FFT. Values are relative to the sum's peak; the drivers add up to the sum. Time is absolute: t = 0 is when the amplifier sends, so the time of flight in measured FRD phase shows up as a later peak. The window starts 1 ms before the peak.
Export as PNG, Export as TXT and Copy Data work in all three views.
Power per part
Select a resistor, capacitor or coil: the Power section shows the worst case over 20 Hz–20 kHz with a full-power sine from the amplifier – RMS, peak and a suggested rating. Real music has far less energy at most frequencies, so this is a safe upper bound, not a prediction. The colour of the RMS value is its status (green OK, amber check the rating, red very high), named in the badge below it.
A capacitor only loses power in its ESR: the section shows that loss (heat) instead of a watt rating – capacitors are chosen by voltage. With ESR 0 it says the capacitor is ideal.
Warnings
Problems appear in the status bar of the canvas (2 warnings); click one to jump to the part. Typical ones:
- Not connected to the amplifier / Minus terminal not connected to ground – the driver has no closed loop, so it does not play.
- Driver terminals are shorted or Component is shorted – a wire connects both terminals.
- No current: … is set to open / switch … is open – the path is interrupted on purpose.
- No ZMA data (using 8 Ω nominal) / No FRD data – simulated as a flat 70 dB response – see missing files.
- Low impedance dip (below 3.2 Ω) and Short circuit (below 0.1 Ω).
- Simulation failed at … Hz – the circuit could not be solved there. Crover leaves a gap in the curves instead of showing something made up; usually a part is floating or shorted.
6Phase and summation
This chapter is about the one thing that surprises almost everyone designing a first crossover: two drivers that each look perfect can add up to something that does not.
Why the sum depends on phase
Around the crossover frequency both drivers play at the same time. What you hear is not the sum of their levels but the sum of their sound waves – and waves can support or cancel each other.
- In phase (0° apart): two drivers at −6 dB each add up to 0 dB – a flat transition.
- 90° apart: two drivers at −3 dB each add up to 0 dB. That is what a textbook 1st- or 3rd-order crossover does.
- 180° apart: they cancel. Two equally loud drivers give a deep notch – in theory silence.
Crover adds the drivers with magnitude and phase, exactly like the air does. That is why the Sum curve can dip or bulge where no single driver curve does.
The crossover dip trap
The classic: woofer and tweeter curves both look fine, they cross neatly at −6 dB, and the sum has a deep hole right at the crossover. Nothing is wrong with the filters – the drivers are about 180° apart there.
Work through it in this order:
- Polarity. A 2nd-order (12 dB/oct) crossover shifts the two drivers by 180° relative to each other, so one of them is normally connected inverted. Invert the tweeter (I) and look at the sum again. If the hole turns into a smooth transition, that was it.
- Timing. If a driver's phase is derived (amber), it has no real timing until you set the acoustic offset. A few centimetres change the phase at the crossover a lot. With measured phase (green) the timing is already there – do not add it again.
- Slopes. Only then change the filter values. The acoustic slopes – filter and driver together – should meet in a similar shape.
Crover helps: when the sum falls more than 10 dB below the louder driver while two drivers are within 6 dB of each other, a banner above the graph says Deep dip at … – phase cancellation. Turn on Phase in the legend to see the two driver phases – where they are 180° apart, the sum dips.
Measured phase, derived phase, and the offset
Everything above only works if each driver's phase is right – including when its sound arrives. That is why the phase source matters:
| Measured phase | Derived phase | |
|---|---|---|
| Where from | your measurement (with timing reference) | calculated from the SPL curve (minimum phase) |
| Acoustic timing | included | missing |
| Acoustic offset | not used (already in the data) | needed – set it by hand |
Measured phase is only as good as the measurement: all drivers need to be measured from the same microphone position with the same timing reference. If you measured each driver with its own gating or time reference, its timing is not comparable – switch those drivers to Derived (or import them with Derive minimum phase from magnitude) and set the offsets yourself.
Curves from the enclosure always have a derived phase – so the offset applies. The listening axis in the enclosure planner proposes it from the positions on the baffle.
Reading group delay
Group delay shows how long each frequency takes to come out, in milliseconds. Crover calculates it from the summed phase after removing the constant delay (the time of flight), so the curve shows what the crossover and the drivers add.
- A rise towards the bass is normal – every high-pass (including the box) causes it.
- Steeper filters give more group delay around the crossover. That is physics, not a mistake.
- A narrow spike usually sits at a sharp dip in the sum – look at the SPL first. As a rough guide, around 1–2 ms in the midrange and treble are considered inaudible.
7Tutorial: your first boxAlpha
In this tutorial I plan a small vented box for a 6.5-inch woofer, from the datasheet to the crossover. The example is the SB Acoustics Satori MW16P-4 – the woofer of the example project – with the values from its public datasheet (REV. 4). Crover computed every number below exactly like this; another driver gives other numbers, the steps stay the same. It takes about 15 minutes.
What you get at the end is an estimate: good enough to plan the volume, the port and a first crossover, but no substitute for measuring the finished box. Why is explained in How accurate is Crover?.
0. Before you start: the level
Create a new project. It holds only the amplifier AMP1 at 100 W. Click it and set its Power to 10 W in the properties.
Why: the planner computes cone excursion and port air for one power, the reference level. Unless you set one, that is the amplifier's power. 100 W is far too much for a 60 W woofer in a living room – the box wizard would propose a huge port for it. 10 W (taken into 8 Ω, i.e. 8.9 V) gives about 100 dB at 1 m with the MW16P-4's 90.5 dB sensitivity. That is loud.
1. Add the chassis and paste its T/S
- Switch to Enclosure at the top. There is no chassis yet; click Add chassis → From a datasheet.
- Copy the parameter table out of the PDF and paste it into the text box below the PDF field as it comes. (With a session you can also drop the PDF itself; then the table shows each value's spot in the sheet.) Crover shows Recognised 15 values: fs 28 Hz, Re 3.4 Ω, Le 0.15 mH, Qms 5, Qes 0.28, Qts 0.27, Vas 50.2 l, Sd 119 cm², Mms 12.8 g, Bl 5.2 T·m, Cms 2.5 mm/N, Rms 0.45 kg/s, Znom 4 Ω, Xmax 6 mm and Pe 60 W.
- Click Apply. The chassis is now called SPK1. It also appears in the crossover, right of the amplifier, not wired yet.
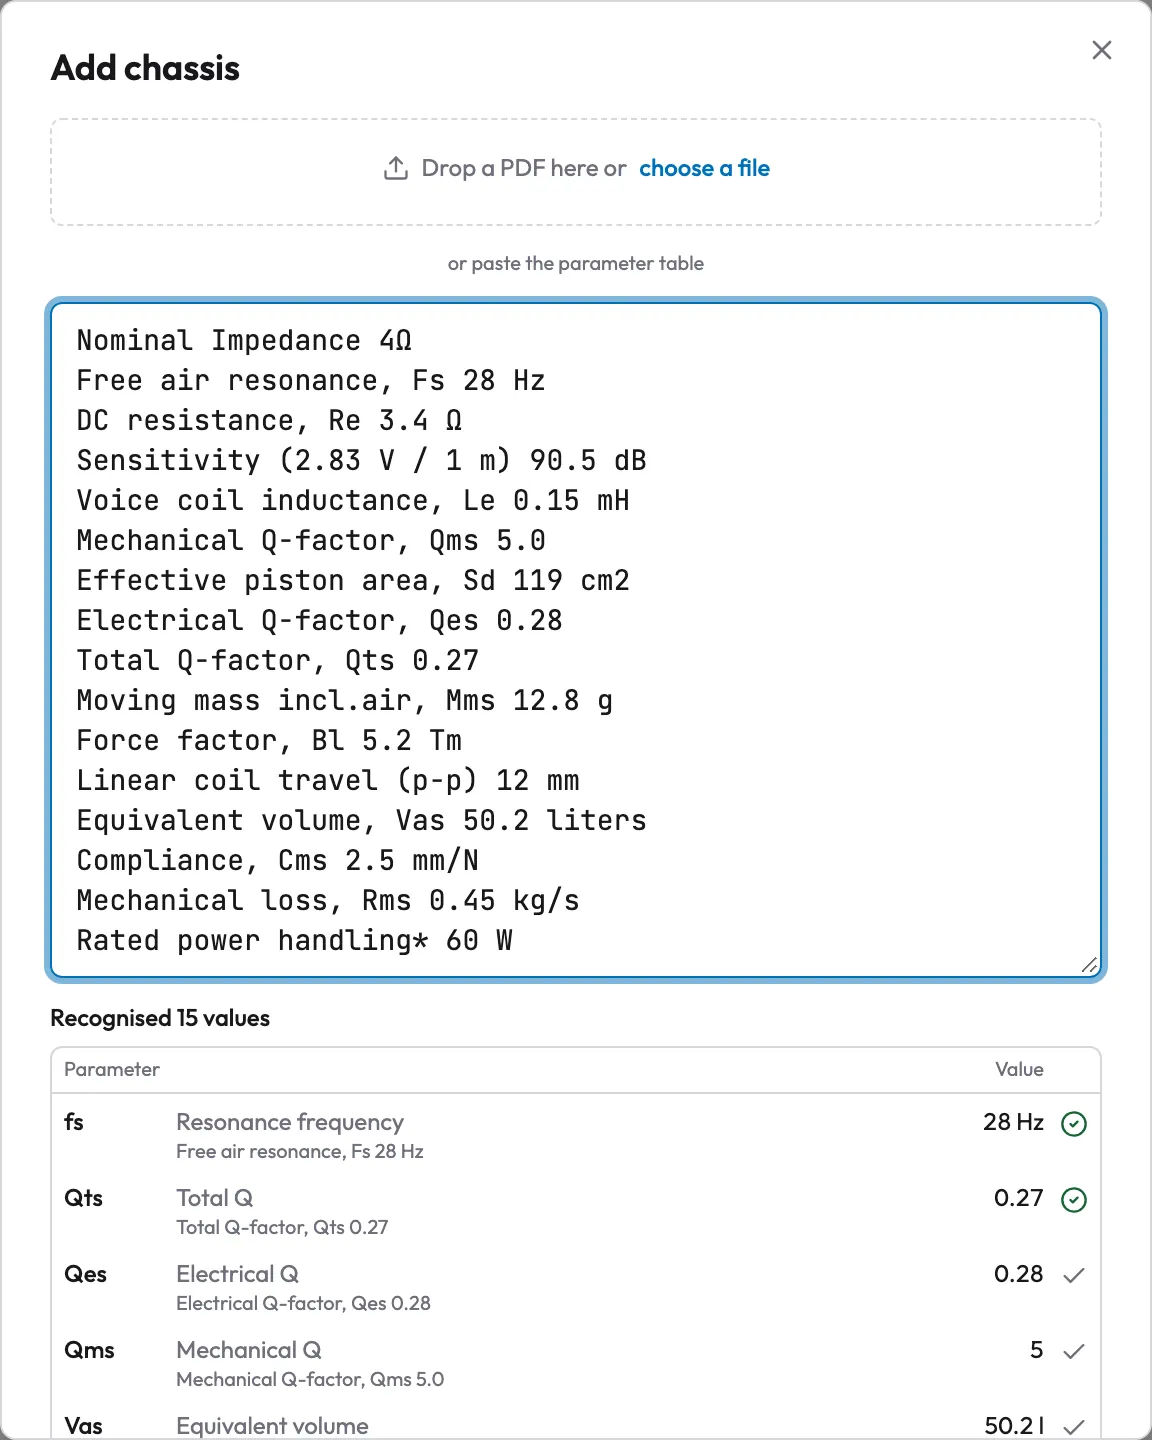
Two lines are worth a look: the datasheet gives the linear travel as Linear coil travel (p-p) 12 mm – peak to peak. Crover halves it and notes printed peak to peak – halved: Xmax = 6 mm. The power handling is called Rated power handling 60 W here and becomes Pe 60 W. For the estimate itself fs, Qes, Qms, Vas, Re and Sd are enough; without Xmax, though, Crover cannot tell when the cone reaches its limit. If your datasheet lacks Xmax or Pe, the review table says so and names the usual names – then enter them in the T/S table.
The chart below already shows a dashed curve SPK1 · infinite baffle: without an enclosure Crover places the chassis on an infinitely large wall. That is the reference, not your speaker.
2. The box wizard: vented or sealed
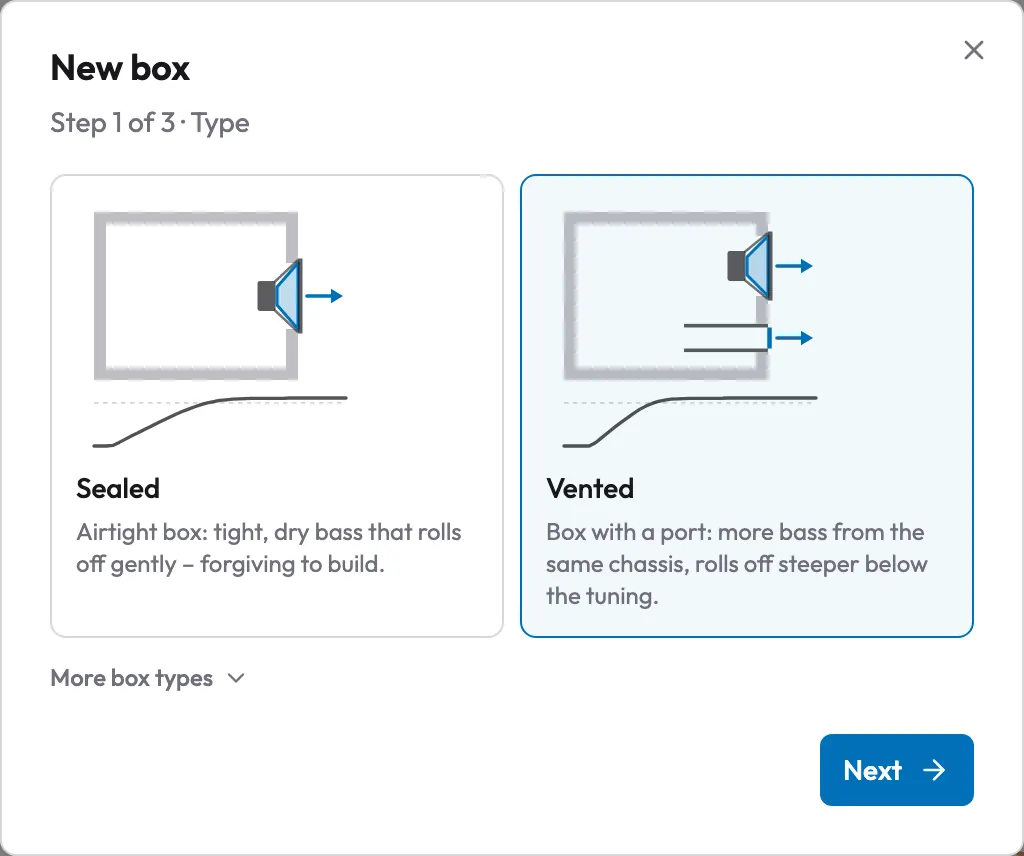
- Click Plan a new box, choose Vented, then Next.
- Under Net volume Crover offers Suggest from T/S: 12.5 l (deep and smooth, SPK1) – the lossless QB3 alignment for a Qts of 0.27. I type 17 l instead and click Next.
- Leave Port: Front, below the chassis as it is and read the proposal before you click Create box.
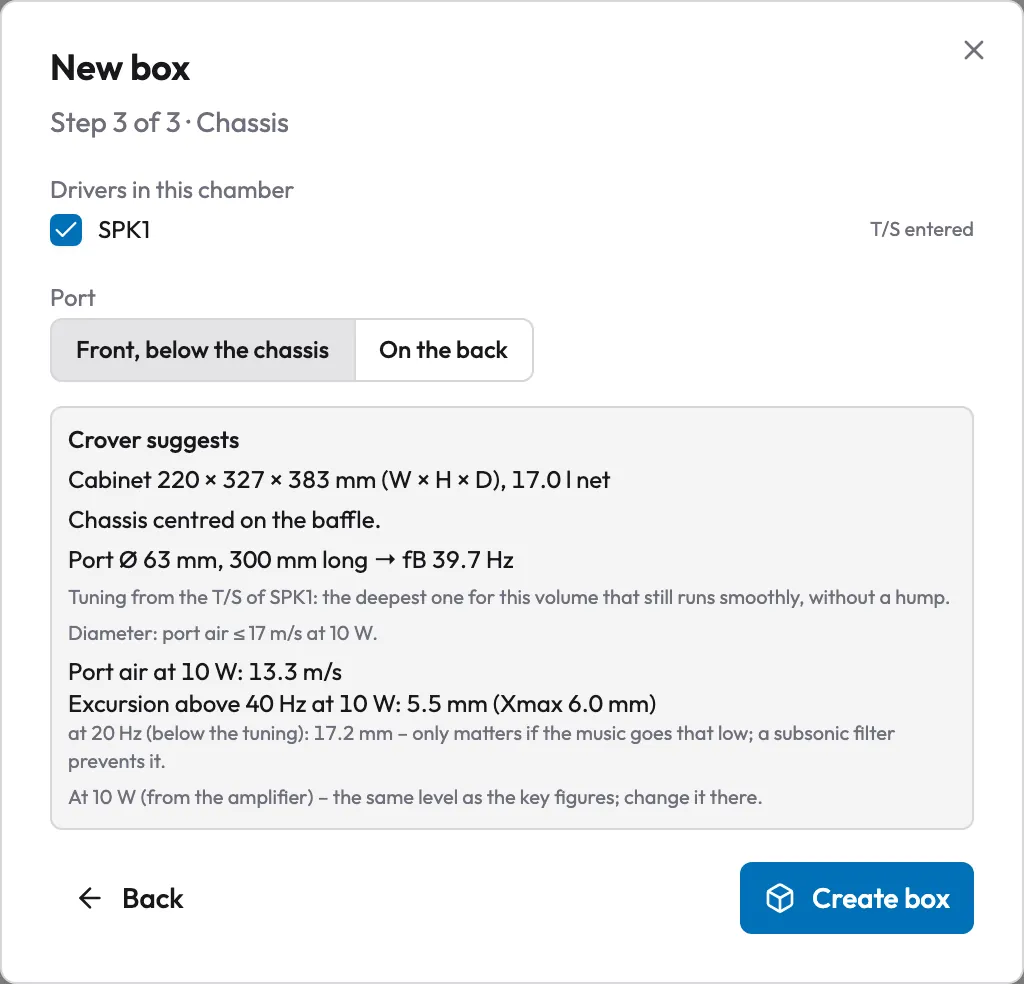
How to read the proposal:
- Cabinet 220 × 327 × 383 mm, 17.0 l net – width and height follow from the chassis and the port, the depth from the volume. Net means walls, chassis and port are already taken off.
- Port Ø 63 mm, 300 mm long → fB 39.7 Hz – the deepest tuning that still gives a response without a hump for 17 l. The diameter is the smallest that keeps the air below 17 m/s at 10 W; above that the port chuffs audibly.
- Excursion above 40 Hz at 10 W: 5.5 mm (Xmax 6.0 mm) – above fB the port holds the cone back, and there it fits. The line below, at 20 Hz (below the tuning): 17.2 mm, is the peak under fB, where the port no longer does. These are the same numbers the key figures show in a moment.
Why 17 instead of 12.5 l? With the suggestion f3 would sit at about 52 Hz, and a port that stays below 17 m/s at 10 W does not fit into the small box – the box wizard warns about that itself (27 m/s). 17 l go deeper (f3 about 44 Hz) and leave room for the port.
And sealed? The MW16P-4 has a very low Qts (0.27). A sealed box with Qtc 0.7 would need only 8.6 l and would then reach just 80 Hz – a driver like this is made for a vented box. We try that in step 5.
3. Read the key figures, add a subsonic filter
After Create box the Key figures card sits at the top right. First give the chassis a name: open the Chassis card, click SPK1 and enter MW16P-4 as its Name. The name is used in the crossover as well. Xmax and Pe are already in the T/S table below – they came with the datasheet.
The first line of the key figures is the verdict: “Goes down to about 44 Hz. At 10 W without problems – clean up to about 12 W. Below 40 Hz the cone passes Xmax from 1.2 W – a subsonic filter prevents that.” The rows below explain it (click a row to see the calculation with your numbers):
- fB 39.7 Hz, f3 44.5 Hz – the frequency the port is tuned to, and roughly where the bass ends (−3 dB).
- Excursion above 40 Hz: 5.5 of 6.0 mm – above fB the port holds the cone back, and there it fits. Below it, in small print: at 20 Hz (below the tuning): 17.2 mm. Under fB the port no longer unloads the cone; it moves almost freely.
- Port air 13.3 m/s – below the noise limit of about 17 m/s.
- Port pipe resonance ≈ 496 Hz – a 30 cm port is also a pipe open at both ends. Without a crossover Crover uses the chassis' piston range (up to 888 Hz); the resonance lies inside it, but only the crossover frequency decides whether it matters. That is why it shows as a hint only (grey, with an “i”). In a two-way crossed near 2 kHz it becomes a warning – the pipe is a real issue then: damping opposite the inner opening or a port with flared ends. The message only goes away when the woofer's low-pass sits below a third of the resonance.
The bottleneck is the excursion below fB. In the warning, click Add a subsonic filter: Crover puts a 28 Hz high-pass (Butterworth 2nd order, about 0.7 · fB) under Pre-filters in front of the amplifier – the kind of thing a DSP or a plate amp does. After that: f3 46.3 Hz, 7.9 mm left at 22 Hz, past Xmax only from 5 W instead of 1.2 W – but still above 6 mm. The warning now says so too, with a setting Crover computed for it: “at 30 Hz, order 4, the cone stays within Xmax”.
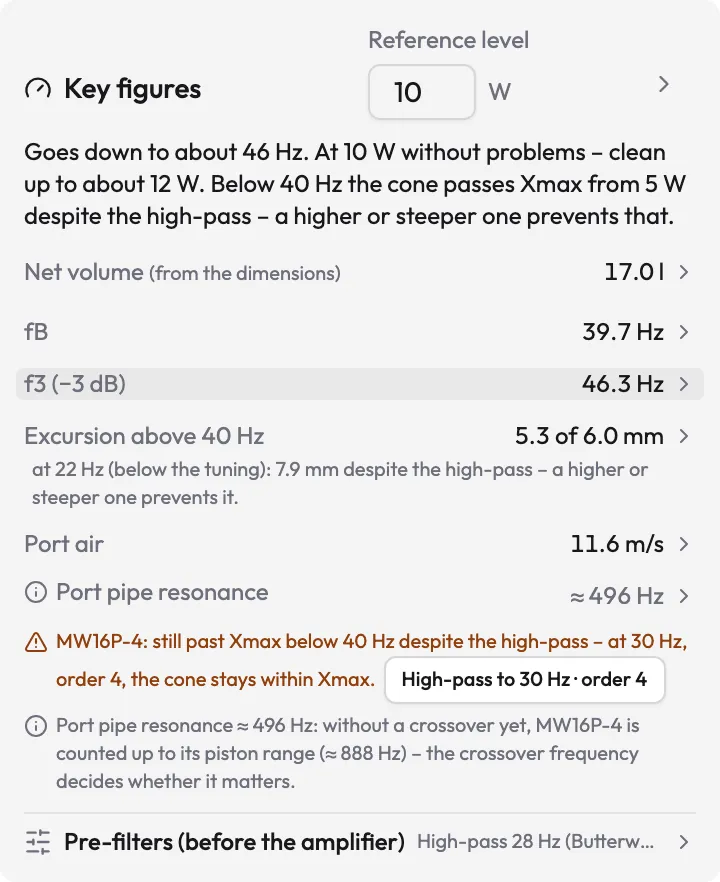
Click High-pass to 30 Hz · order 4. The filter gets steeper and a little higher, the warning goes away, and the verdict reads “Goes down to about 45 Hz. At 10 W without problems – clean up to about 12 W.” f3 is now 45.0 Hz – even lower than with the gentler filter, because the steep one at 30 Hz takes less away above it. Whether you need it depends on the music: organ and electronic music have notes around 25 Hz, most other music hardly any. For comparison, set the Reference level at the top to 50 W for a moment (the small arrow next to the field): the excursion then becomes the bottleneck, and the verdict tells you up to how many watts the box stays clean.
4. In the 3D planner: chassis, port, dimensions, volume
On the left you see the box in 3D. Dragging next to a part turns the view, scrolling zooms; Front (2D) shows the baffle straight from the front with dimension lines. Press on the chassis or the port opening and drag: the part moves across the baffle and snaps to the centre line and a 5 mm grid. The chart follows live, because the position on the baffle changes the edge diffraction – the small ripples between 300 Hz and 2 kHz. A click without dragging opens the part's card on the right. The port sits below the chassis, as chosen in the dialog; drag it wherever you like – the fit check reports when it hits the basket or the magnet.
Now a change of size, as it often happens while building – one litre more:
- Open Type & volume and type 18 l as Net volume. Width and height (the baffle) stay, the depth follows: 383 becomes 402 mm.
- The port kept its length, so the box is now tuned lower. Open Port and type Tuning fB 40 Hz: Crover works out the length again (277 instead of 300 mm).
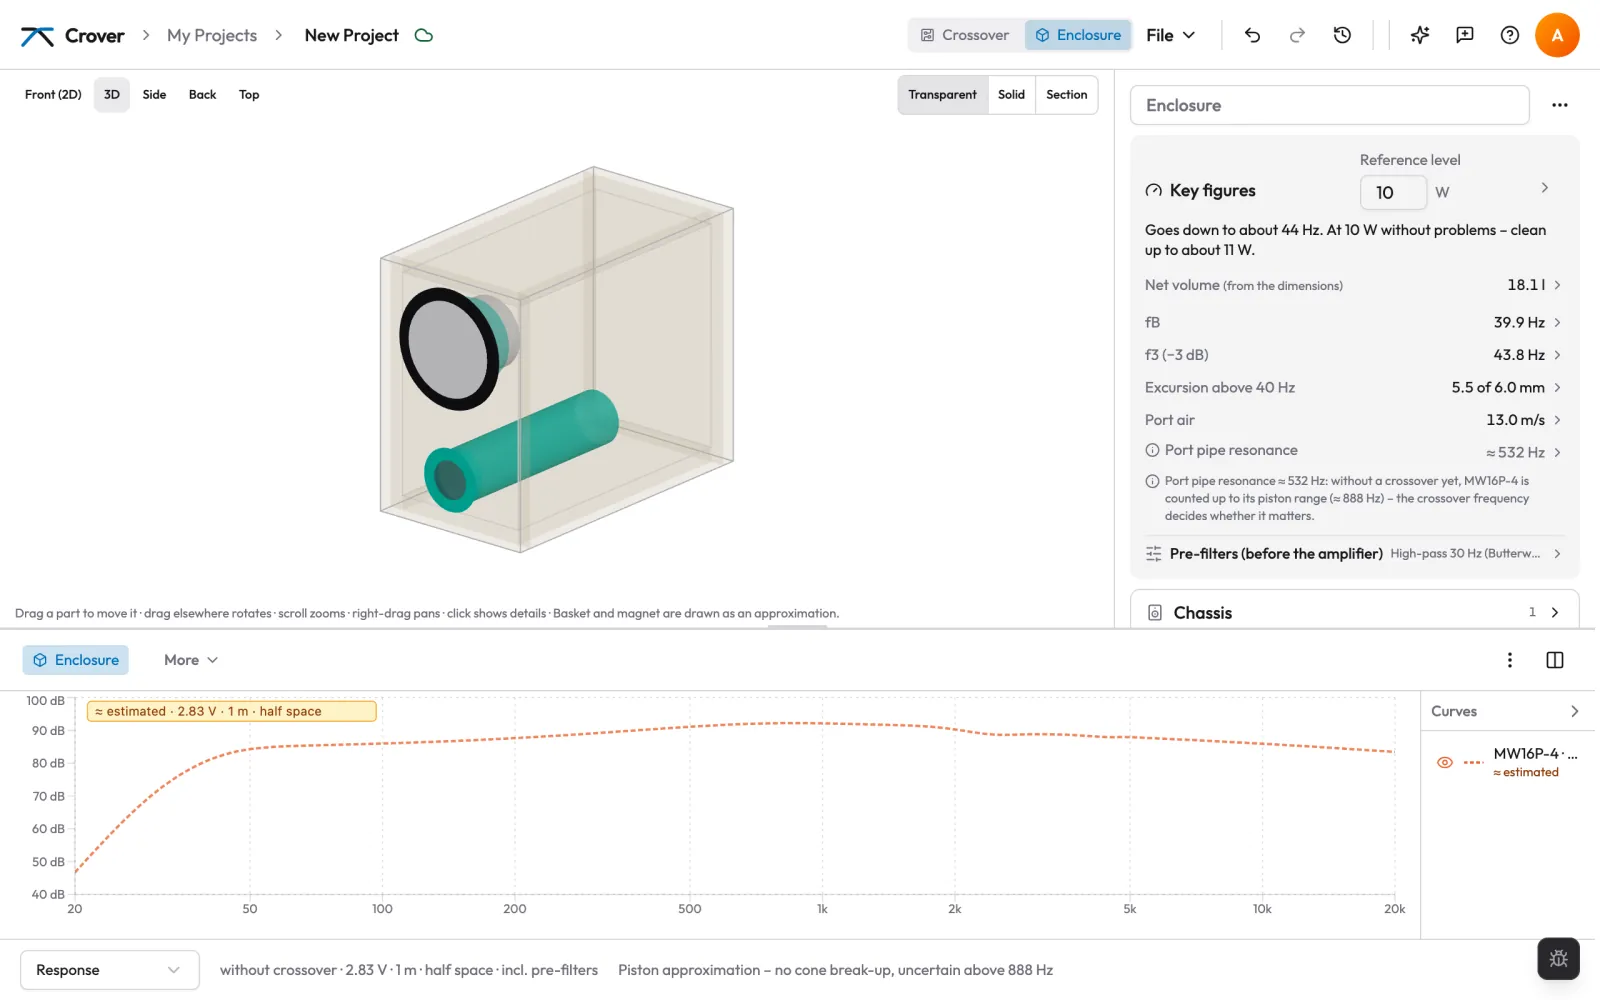
Result: 18.1 l, fB 39.9 Hz, f3 43.8 Hz – a good hertz lower for 2 cm more depth. Each change is one Undo step. The rule behind it: you type the volume, the geometry follows; you type the tuning, the port length follows. Change the volume and the port length stays put – so fB moves. A new diameter (or another number of ports) Crover compensates itself: fB stays, the length follows. More in Volume and dimensions.
5. Add a variant and compare
- Open the … menu at the top right of the sidebar → Plan a new box, choose Sealed and take Suggest from T/S: 8.6 l (balanced, without a peak, MW16P-4).
- The last step already has As a new variant selected: Box A stays. Click Create box.
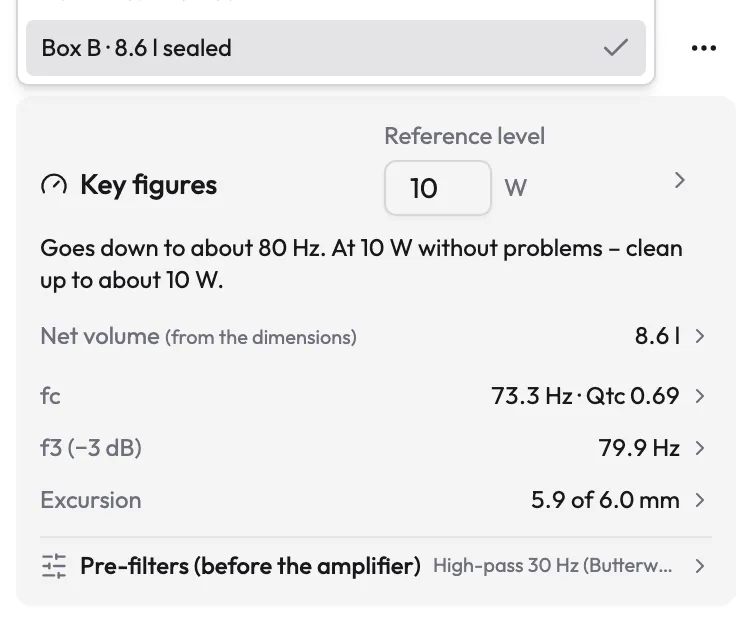
At the top of the sidebar you now pick Box A · 18.1 l vented or Box B · 8.6 l sealed. Box B: fc 73.3 Hz at Qtc 0.69, f3 79.9 Hz, clean up to about 10 W. Against the vented box's 44 Hz that is an octave less bass – confirming what the low Qts suggested. Only the chosen variant ever plays: the key figures, the chart and the crossover's estimated curves follow it. Switch back to Box A for the next step.
6. Into the crossover: curves from the enclosure
- Switch to Crossover at the top. Wire the amplifier's plus and minus to plus and minus of MW16P-4.
- Click the chassis. Further down in its properties is Curves from the enclosure: switch on Use curves from the enclosure.
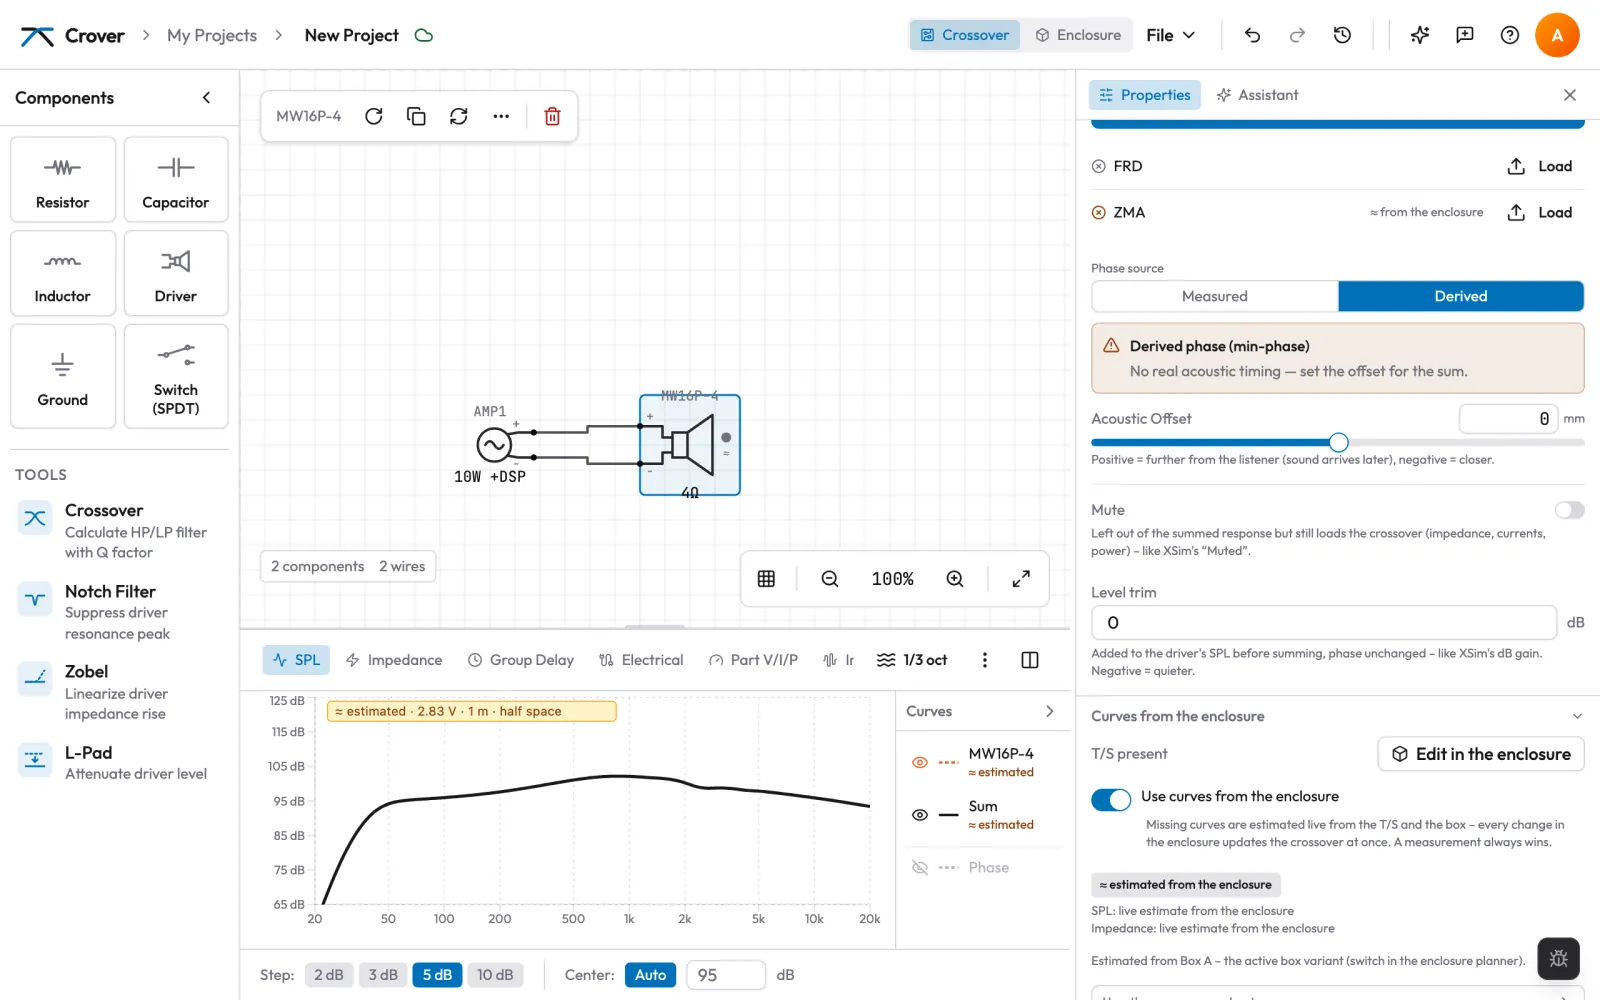
Instead of the flat 70 dB stand-in, the estimate from Box A now plays: response and impedance, both ≈ estimated from the enclosure, dashed and marked ≈ estimated · 2.83 V · 1 m · half space in the chart. The curve sits around 100 dB because the amplifier delivers 10 W. Change something in the enclosure and the crossover follows at once. From here on you build the crossover as usual (parts, network tools).
Measured beats estimated. Once you load an FRD or ZMA, Crover uses the measurement – the switch does not change that. The estimate is a piston model: it knows no cone break-up (for the MW16P-4 it gets uncertain above about 888 Hz) and treats the baffle from the front only. For a crossover you order parts for and solder, measure the chassis in the finished box: near field or gated, plus the impedance. If you measure gated in the room, Add the low end from the enclosure below … Hz fills in the uncertain bass from the model.
7. What comes next: tweeter, midrange, passive radiator, bandpass
- Tweeter: add it as in step 1 (or bring it over from the crossover with Take over from the crossover) and drag it above the woofer. In its chassis card set Back to Own sealed back – a tweeter is closed at the back and must not count towards the vented chamber (without T/S Crover does this by itself). With the listening axis Crover then proposes the acoustic offsets.
- Midrange in a three-way: Back: Own chamber behind it builds a closed box right behind the chassis, proposed for Qtc ≈ 0.7. Its outer volume comes off the vented chamber. See Chambers.
- Passive radiator instead of a port: in Type & volume switch to Passive radiator, paste its datasheet and tune it to fB with the added mass – handy when a 30 cm port does not fit.
- Bandpass: choose Bandpass (4th order) in the wizard; the chassis then sits in the partition between two chambers. See Passive radiator and bandpass.
Common mistakes
- Xmax entered peak to peak. Datasheets often give the travel “p-p”. Xmax is half of it – otherwise Crover reports twice the headroom. When you paste, Crover halves it itself (the line says printed peak to peak – halved); when you type it, take half.
- Planned at 100 W. The default amplifier has 100 W, and the wizard sizes the port for it. Set the amplifier first, or the reference level afterwards, to what you really listen at.
- Volume changed, fB forgotten. More volume with the same port tunes lower. Type fB again afterwards – the length follows. (For the diameter Crover keeps fB by itself.)
- Too little room behind the port. Leave at least one port diameter between the inner opening and the back wall. A typed volume keeps that gap; when you drag the port or change sizes by hand, the fit check tells you how much to shorten it or where to put it.
- The switch is off. Without Use curves from the enclosure the crossover plays the flat 70 dB stand-in, however well the box is planned.
- Ordered from the estimate. Plan with it, but fix the part values after measuring the built box.
8Enclosure and T/SAlpha
With a driver's Thiele/Small parameters (T/S) and an enclosure, Crover estimates its frequency response and impedance while you have not measured yet. You can plan the crossover before the box is built – knowing that it is an estimate. To get started, the tutorial walks through the whole way with one example; this chapter is the reference.
Two workspaces, one project
Crossover and Enclosure work on the same drivers. The crossover shows the schematic, the palette, the measurements (FRD/ZMA), phase, offset, level and every crossover chart. The enclosure shows the 3D planner and its sidebar – the T/S, chambers and ports live there only – and the chart in the enclosure views; there the crossover charts are behind More.
In the crossover every driver shows the section Curves from the enclosure: with T/S it says T/S present and Edit in the enclosure, without No T/S yet and Enter in the enclosure. Both buttons open exactly that chassis in the planner.
Chassis and T/S parameters
The Chassis card in the planner lists every chassis of the box. A click opens one: name, mounting place (only when there is a partition), back, position (From the left, From the top) and the section T/S parameters & measurement. The mounting depth shows under Show all settings or once you have entered it; otherwise Crover estimates it from the cone diameter.
T/S get in through one button: Add T/S…. The dialog offers four ways, each with one line of explanation: From a datasheet – drop or choose the PDF (Crover reads it on its server, which needs a session, a guest one works too) or paste the parameter table as text; both end in the same review table with check marks, for text with the line each value came from. From WinISD (.wdr) (a .wdr can also be dropped straight on the card), From your own measurement (see “T/S from measurement” in the chapter Add data) and By hand (opens the empty T/S table).
- Required: fs, Qes, Qms, Vas, Re and Sd. The model computes with these.
- Optional, but they matter: Le (the treble roll-off), Xmax (the excursion limit and the key figures' verdict), Pe with Znom (the heat limit in Max. power), Dd (cone diameter, otherwise from Sd) and the driver's displacement (taken off the net volume).
- Only for checking: Qts, Bl, Mms, Cms and Rms. When they differ by more than 3 % from what fs, Q and Vas imply, the card says “The values do not fit together” with both numbers. The stated fs is checked against the resonance of Mms and Cms.
When pasting, Crover also recognises the names datasheets often use for Xmax and Pe: a travel given “p-p” (peak to peak, such as Linear coil travel (p-p)) is halved to Xmax and marked printed peak to peak – halved; Rated power handling, Nominal power or Belastbarkeit become Pe, peak and music ratings do not. The line “Still missing: …” lists missing required values; when Xmax or Pe is missing, the review table says below what they are needed for and how datasheets name them.
You can start with the box: Add chassis opens the same dialog and creates a chassis from its result that also appears in the crossover – right of the schematic, not wired, with the switch Use curves from the enclosure off. If there is a box already, Crover puts it on a free spot of the baffle. Drivers you already have in the crossover go onto the baffle under Take over from the crossover with Take over; their switch stays as it was.
A whole WinISD project (.wpr) brings the driver and the box together: Import WinISD project (.wpr) in the empty planner or in the … menu, or drop the file on the planner. A report then says what was taken over.
Chassis dimensions
Below the T/S are the chassis' Dimensions: Frame Ø (or, under More dimensions, a Square frame with width and height), Cut-out Ø, Mounting depth, Magnet Ø, Flange thickness and Bolt circle Ø. They belong to the chassis, not the box – every box variant and the crossover share them. An empty field shows what Crover estimates instead (≈, from the cone). When Crover reads a datasheet PDF it offers frame, cut-out and mounting depth too (Also apply the dimensions), with the spot in the sheet as their origin.
The planner draws frame, cut-out, flange and magnet with these values, and the build check uses them for depth, cut-out spacing, ports, partitions and chambers behind the chassis; each note says which value it used (“Used: mounting depth 82 mm (datasheet)”). A Mounting depth in this box (under Show all settings) applies to this box only and wins.
Creating a box
Plan a new box (in the empty planner, otherwise in the … menu at the top of the sidebar) opens the box wizard, the New box dialog, with three steps:
- Type: Sealed or Vented; under More box types Passive radiator and Bandpass (4th order) (subwoofers only – when the main chassis does not look like one, e.g. fs above 40 Hz, a cone under 200 cm² or Xmax under 5 mm, the card says so). Each card shows the type as a cross-section with its typical response (see box types).
- Size: Net volume or Outer dimensions, plus the wall thickness (default 19 mm). The Suggest from T/S button sets a volume for the driver with the largest cone: sealed for Qtc 0.707 (balanced, without a peak), vented QB3 for a Qts up to 0.383, C4 above. For a bandpass you choose the band width here instead of the size.
- Chassis: which ones go in, for a vented box the port Front, below the chassis or On the back – and below it the proposal.
The proposal gives the outer dimensions and the net volume, places the drivers (centred; with two or more the smallest on top) and for a vented box a port. The tuning is the deepest one that still runs smoothly without a hump for this volume; without T/S Crover takes 45 Hz (cone from 150 mm) or 55 Hz. The diameter is the smallest standard tube that keeps the air at or below 17 m/s at the reference level. A port needs depth: if you typed a volume, Crover shapes the box so the port fits; only when the baffle does not allow that does the port get thinner (down to 70 %), and the dialog says why. If even the thinnest sensible port does not fit, the box gets as deep as the port needs – it then holds more than you typed, the dialog names both volumes, and the port is tuned for the volume the box really has. Front, below the chassis puts the port below the drivers; without room there it sits beside or above them, and the dialog says so. Excursion, port air and fB in the dialog are the same numbers the key figures show afterwards: for a vented box the excursion above fB, the peak below it on the line underneath.
Good to know: the suggestions are computed lossless. Alignment tables in the literature and on community sites often use the row for losses QL 7 and so come out at about 5 % more volume and a slightly higher tuning. Both are right, just computed differently.
Only the main driver and identical ones (fs, Vas and Sd within 15 %) play the box. Other chosen drivers with T/S get their own sealed back. When there is a box already, the dialog finally asks: As a new variant (the default) or Replace the current one – see Box variants. Everything stays editable afterwards.
Volume and dimensions
One cabinet is one chamber, and every chassis mounted on its baffle plays in it – there is nothing to tick. The net volume always comes from the dimensions: outer size minus twice the wall per axis, minus what the chassis (displacement from the T/S) and the ports take away. It is the first line of the key figures and follows every change of size at once.
Type a net volume in the Type & volume card (with several chambers: Chambers) and the geometry changes: width and height – the baffle with its drivers – stay, the depth follows (“Depth 372 mm gives 20.0 l net”). Scale proportionally instead keeps the proportions. The depth never gets shorter than the drivers and ports need – a front or rear port needs its length plus one diameter of room to the opposite wall, as the fit check asks; the card says so when that limits the volume. Each change is one Undo step.
A port keeps its length meanwhile – so more volume tunes lower. Type fB again in the Port card afterwards and the length follows. The Damping (Little damping, Medium damping, Heavily damped = Qa 100, 30, 10 at Ql 10) is under Show all settings.
Older projects stored a typed volume next to the dimensions. If it does not match them (more than 2 % apart), the simulation keeps using it and the key figures say “Volume 20 l does not match the dimensions (34 l)” – Adjust dimensions sets the depth to that volume, Use volume from dimensions drops it.
Chambers: partitions, a chamber behind a chassis, an own back
Every chassis card has a Back choice:
- Into the cabinet (woofers): it plays the chamber it sits in front of.
- Own sealed back (tweeters, sealed midranges): no chamber, it plays on the baffle. A chassis without T/S gets this automatically – it could only miscount the box.
- Own chamber behind it (the usual midrange chamber of a three-way): a closed box or tube right behind the chassis.
The chamber behind starts with a proposal – the volume for Qtc ≈ 0.7 from the T/S, otherwise 4 l, a little deeper than wide and at least 2 × 10 mm wider than the cut-out – and is heavily damped. It always stays inside the cabinet: when you type its net volume it grows backwards first (the face stays) up to the back wall or the next part behind it, then sideways into free space – the cut-out always stays within its face. If the volume does not fit, it stays as it was and the card says how much fits and what helps (a smaller volume, a deeper cabinet, moving the chassis). Typed inner dimensions that would hit a wall or a part are refused the same way. Its walls are as thick as the cabinet walls (or your value) and drawn as boards in 3D; where a side lies on a cabinet wall or a partition (or the lid on the back wall) it shares that board. Its outer volume – the inside plus its own walls – comes off the chamber around it (the key figures show both, the sub-chamber as “Chamber behind MT-120” with its own fc, Qtc and f3). Drag the chassis and it comes along, stopping where it would hit a wall or a part. Chambers behind a chassis are always sealed.
Add chamber opens a menu. At the top, under Chamber for a chassis (behind it), there is an entry Chamber behind … for every chassis on the baffle without its own chamber. Below, Split the cabinet with a board (with several chambers Split … with a board) divides a chamber with a partition – horizontal, placed beside its drivers and ports so they stay where they are; the new chamber's card says what it still lacks. A partition is as thick as the walls and runs through the full depth. Drag it in the 3D view or turn it vertical in the chamber card (straight from the menu only with Show all settings); both volumes follow at once.
Drivers and ports belong to the chamber they sit in front of. With several chambers, a typed volume moves that chamber's partition; only when that is not enough does the depth change – for all chambers. Remove chamber takes its partition out again. A port through a partition (from chamber to chamber) is not computed yet.
Vented, passive radiator and bandpass
Side cross-section, baffle on the right; blue is where sound comes out. The curves below are computed by Crover's model for an example chassis (MW16P-4) – they show the typical shape, not your box.
Vented. The Port card (only with a vented chamber) has the position, the inner diameter and Tuning fB; the length follows from fB. A new diameter, another number of ports or other slot sizes Crover compensates: fB stays, the length follows (including the volume the port itself takes). If the volume is not enough for that, the card says that fB has moved. Type the length yourself and fB follows; when the volume changes, the length stays – and fB moves. Where the port sits you choose with Front · Back · Side · Bottom; Crover puts it on a free spot of that panel (clear of basket and magnet) and turns the view there. Show all settings adds several ports, slot ports, the end correction and the length to type directly. The fit check says what to do – for example how much shorter a port must be because at least one diameter must stay free behind its inner opening, or on which panel it has room.
Passive radiator. Instead of a port a diaphragm without a motor moves. Choose Passive radiator in Type & volume and enter its datasheet values (area Sd, moving mass Mms, compliance Cms or resonance fs, Qms, Xmax) or paste the datasheet; it is tuned with Added mass – type a tuning fB and Crover works out the added mass. The radiator moves against the air in the box and its own suspension: fB = fp·√(1 + Cap/Cab), fp being its resonance with the added mass. The response has a dip at fp and falls off below it. The key figures show fB, the dip fp and the excursion of the driver and the radiator against its Xmax – there is no air speed. When the radiator passes its Xmax, Crover warns and names it as the bottleneck in the verdict, at the same power Max. power shows for it. The radiator sits on a panel like a driver; drag it in the 3D view (onto another panel too); on the baffle it gets its own edge diffraction. In the New box dialog it is prefilled with twice the driver's cone area (twice the mass, half the compliance), the volume like a vented box and the added mass for the same smooth tuning.
Bandpass. A cabinet with two chambers and the chassis in the partition: in the chassis card choose Mounted in “Partition – cone into chamber 2”. The cone faces the front chamber, its back the rear one; the listener only hears what comes out of the ports. With the rear chamber sealed and the front one vented it is a 4th-order bandpass, with both vented a 6th-order one. In the planner the chassis sits visibly in the board; drag it along it and in depth. The rear chamber's key figures show the whole system: lower and upper −3 dB limits, the level in the band above the driver alone, the excursion and the air in each port. A datasheet or baffle FRD of a driver in a bandpass is replaced by the estimate – you never hear the cone itself.
The New box dialog only proposes the 4th-order bandpass, with the textbook alignment from fs, Qts and Vas: rear chamber Vr = Vas/((Qbc/Qts)² − 1), front Vf = (2S·Qts)²·Vas, fB = Qbc·fs/Qts (S = 0.7 = no ripple). The band width (wide · medium · narrow and louder) sets Qbc to 0.5, 0.7 or 1.0, never below 1.1 · Qts. As for a vented box it shapes the cabinet for the port that keeps the air at 17 m/s; only when the chambers would then be too low for the port or the driver does it take a thinner one (down to 70 %) and say why. Only the largest driver and identical ones go into the partition; other chosen drivers sit in front with their own sealed back.
Port pipe resonance
A port is also a pipe open at both ends: at f ≈ c / (2·L_eff) – L_eff being the port length plus the end correction, a slot counting like a round port of the same area – it resonates itself, and what the driver plays there comes out of the port as a narrow peak. The key figures show it as Port pipe resonance and speak up when it lies where the driver still plays (up to the −6 dB point of its low-pass) or less than 3× above it. Without a crossover the driver's piston range counts – then it is only a hint (grey, with an “i”), since only the crossover frequency decides whether the resonance matters. A bandpass radiates through its ports only: the ports of both chambers count, and without a crossover it ends at the band's upper −3 dB limit. What helps: a shorter or flared port, the port on the back (that advice is left out when it already sits there), damping opposite the inner opening, or a lower crossover.
Box variants
Variants are alternatives for the same drivers – Box A, Box B, … each with its own dimensions, chambers, ports and driver positions. A new one comes from the New box dialog (As a new variant) or from Duplicate as new variant in the … menu. With two or more, a picker like Box B · 8.6 l sealed sits at the top of the sidebar; each switch is one Undo step. The menu then also has Rename variant and Delete variant (with a confirmation); with a single box the entry is Delete enclosure. At most 20 variants per project.
Only the active variant ever plays: the key figures, the enclosure chart, the crossover's estimated curves (“Estimated from Box B”), the assistant and a publication see only it. To compare, switch back and forth; a chart with both variants on top of each other does not exist yet.
The 3D planner: view and handling
3D rotates freely; Front (2D), Side, Back and Top look straight at a panel like a drawing, with dimension lines. At the top right you choose the walls: Transparent, Solid or Section.
- Mouse: pressing and dragging on a driver, port, passive radiator or partition moves the part. Dragging next to it turns the view (in the straight views it pans), scrolling zooms, right-dragging pans.
- Snapping: to a 5 mm grid, to the baffle's vertical centre line and to the axes of other parts (within 8 mm); with Alt to the grid only. The cut-out keeps at least one wall thickness (at least 5 mm) from the edge.
- Changing panels: drivers stay on the baffle; ports and passive radiators move over an edge onto the next panel.
- A click without moving opens the part's card in the sidebar. The drawing never changes size while doing so.
- Tablet and touch: one finger on a part moves it, one finger next to it rotates (in the straight views: pans), two fingers zoom and pan, a tap shows the details.
Each drag is one Undo step. The sidebar starts with the name or the variant picker and the … menu, then come Key figures and the cards Chassis, Cabinet & baffle, Type & volume, Port and Advanced; a closed card shows a one-line summary. Show all settings under Advanced adds damping, end correction, slot ports, inner dimensions, mounting depth, edge shape and the listening axis. A value you have changed stays visible anyway.
Understanding the key figures
At the very top is a verdict in plain words, such as “Goes down to about 46 Hz. At 10 W without problems – clean up to about 12 W.” or “Clean up to about 9 W – beyond that the port chuffs.” It names the bottleneck – the cone, the port or the passive radiator, whichever gives up first (that row carries the bottleneck mark). Without Xmax it says “Whether 10 W stay clean only Xmax can tell – enter it in the T/S.” Watts are rounded down, so “clean up to” never promises more than the box holds. Click a row to have it explained with your numbers:
- Net volume (from the dimensions) – the air the driver works against: from the dimensions, minus walls, drivers and port.
- fB (vented) – the frequency the port is tuned to. There the port helps most and the cone moves least. fc · Qtc (sealed) – the box's resonance and Q.
- f3 – the lowest note that still comes almost in full (3 dB down). Below it the bass falls off quickly – the box goes down to about f3.
- Excursion – how far the cone has to move and how far it can move cleanly (Xmax). Past Xmax it distorts, further still it bottoms out. For a vented box the row shows the peak above fB (“Excursion above 40 Hz: 5.5 of 6.0 mm”), since there the port holds the cone back. Below it the port no longer does; that peak is in small print underneath (“at 20 Hz (below the tuning): 17.2 mm”) – it only matters if the music goes that low, and a subsonic filter prevents it (with a high-pass already there it says “despite the high-pass”). For a sealed box the peak from 20 Hz to 1 kHz counts.
- Port air – how fast the air flows in the port. From about 17 m/s you hear chuffing; a larger diameter (the port then gets longer) or less power helps.
- Port pipe resonance – see Port pipe resonance.
Warnings are sentences with the next step: past Xmax above the tuning → at most so many watts, or a larger box or driver; past Xmax only below the tuning → a subsonic filter or, when there is one, a higher or steeper one (both with a button, see Pre-filters); the port chuffs → a port with a larger diameter (proposed) or less level; the passive radiator passes its Xmax → at most so many watts or a larger or second radiator. Warnings carry an amber triangle, hints a grey “i”. The key figures and the New box dialog drive the driver directly (with the pre-filters only, without the crossover); the enclosure chart includes the crossover once the driver is wired.
One reference level
Excursion and air speed depend on how loud you listen. The planner uses one level for them everywhere – in the New box dialog, in the key figures and in the enclosure chart: the Reference level in W into 8 Ω (U = √(8·P)). By default it is your amplifier's power, 50 W without an amplifier. Change it at the top of the key figures (press Enter to apply) or with the quick levels 1 W · 10 W · 50 W · Amplifier (… W) behind the small arrow next to the field; the round arrow (Back to the amplifier) resets it. Normal listening needs about 1–5 W, only party level more. Since the New box dialog sizes the port for this level, it pays to set it before the first proposal – for the first box through the amplifier's power.
The enclosure charts
In the Enclosure workspace the select at the bottom left picks what the chart shows: Response (per chamber, without the crossover), Impedance (per driver, without the crossover), Group delay, Excursion (peak, with Xmax as a line), Port air velocity (with the 17 m/s line), Max. SPL and Max. power. All at the reference level and with the pre-filters; excursion, air, group delay and the max views with the crossover once the driver is wired, without it before. For response and impedance, Overlay the measurement puts a loaded measurement of a driver with T/S on top for comparison.
Max. SPL and max. power
For each frequency, the amplifier power at which the box reaches its first limit, and the level it plays then (1 m, half space). Three limits, each as a dotted line: the cone at Xmax (peak), the port air at 17 m/s and – when the T/S give Pe – the power handling at the driver's terminals (into the nominal impedance). In Max. power a dashed line also marks 25 m/s in the port as a warning. A passive radiator adds its Xmax as another limit (there is no port limit then); for a bandpass the fastest port counts and the level comes from the ports only. The solid curve is the lowest limit; the line next to the select below the chart says which one applies where (“Limit: cone 20–28 Hz · port 29–43 Hz · heat 86–20000 Hz”). Power as at the amplifier, P = U²/8. The axis reaches the largest of 100 W, four times the reference level and 1.5 · Pe. Crossover and pre-filters are included: a low-pass unloads the woofer at the top, a subsonic filter below fB.
Group delay
How long the bass “takes”, in milliseconds: the box alone (dashed, with pre-filters) and, once the crossover plays the driver, with the crossover (solid). A vented box has more delay around fB than a sealed one, and a subsonic filter adds some.
Pre-filters before the amplifier
Active filters in the signal before the power amp – DSP, plate amp, a subsonic filter in the amplifier – go under Pre-filters (before the amplifier): in the planner's key figures and in the amplifier's properties. Without an amplifier in the crossover there are none. You can choose a high-pass/subsonic (Butterworth 1st–4th order or Linkwitz-Riley 2nd/4th, for 2nd order optionally with your own Q), the Linkwitz transform (move a sealed box's resonance f0/Q0 to fp/Qp) and EQ bands (peak, low and high shelf). They act before every driver: the crossover, key figures, excursion, port air and max. SPL include them; the impedance stays the load at the amplifier.
When the excursion below fB passes Xmax and there is no high-pass yet, the warning offers Add a subsonic filter (Butterworth 2nd order at about 0.7 · fB). If an existing high-pass is not enough, Crover works out the smallest change that keeps the cone within Xmax below fB – a higher frequency or a steeper order, whichever costs less bass –, names it in the warning and sets it with one click (for example High-pass to 30 Hz · order 4). If even 4th order at fB is not enough, the warning says what remains.
Curves from the enclosure in the crossover
Whether the crossover uses the enclosure is your choice per driver, in its properties under Curves from the enclosure. For new drivers the switch is off – the driver plays exactly as without an enclosure (older projects whose drivers already had T/S load with the switch on). A measurement always wins; a measured impedance is never replaced. The section How the curves come about names four cases:
- No measurement, Use curves from the enclosure on: the whole curve is estimated from the T/S and the box, live – change the volume or the port in the enclosure and the crossover follows at once. Without T/S or with an incomplete chamber the section says what is missing.
- Baffle or datasheet curve, Add the low end from the enclosure on: such a curve lacks the box and your baffle. With T/S in a chamber, Crover uses the box model below a splice frequency (at least 200 Hz, twice fB for a vented box, three times fc for a sealed one), blends into your curve over half an octave, keeps its level and adds this cabinet's edge diffraction. A missing ZMA comes from the enclosure. The phase is derived from the result, so the offset applies. Without a chamber but on the baffle only the diffraction is added.
- Measured in the cabinet, Add the low end from the enclosure below … Hz on: for a gated room measurement that is unreliable at the bottom. Below the Splice (default 300 Hz) the box model with its port replaces the measurement, blended over half an octave and shifted to the measured level. No diffraction is added – the measurement already contains it – and nothing above the splice changes, not even the measured phase. The measured impedance stays.
- Off: the measurement as it is; without one the flat 70 dB stand-in.
Estimated curves are marked everywhere: ≈ estimated from the enclosure in the driver section, dashed with ≈ estimated in the legend, the tooltip and inside the chart itself – also in the PNG export and on the public project page. The mark cannot be hidden. With several box variants the section says which one the estimate comes from.
Where the measurement was taken
When you import an FRD with the enclosure feature, the import dialog asks Measured where?; the driver's properties show it too. In its cabinet (the default, also for every older measurement) – case c above; On a baffle / half space or Datasheet curve – case b; Simulated elsewhere (AJHorn, Hornresp …) plays unchanged, and the legend names the program.
How Crover estimates
- Convention: 2.83 V at the terminals, 1 m distance, on axis, half space (infinite baffle) – like a datasheet. The crossover is added by the simulation, as with a measurement.
- Bass: an equivalent circuit of driver, box (volume, losses Ql/Qa/Qp) and port – the same model as WinISD; passive radiator and bandpass as a network of several chambers.
- Midrange and treble: a rigid piston, flat on axis; at the top the curve falls only through the voice-coil inductance. The estimate has no cone break-up.
- Baffle: when the driver sits on the baffle in the planner and the baffle has a width and a height, Crover computes the edge diffraction (see below). With only a width it uses a simplified step from −6 dB (bass) to 0 dB (treble).
- Phase: the minimum phase of the magnitude, as with a derived phase. So the acoustic offset applies.
- Without a chamber: a driver with T/S but no chamber – usually the tweeter with its own back – is estimated on an infinite baffle.
Edge diffraction and positions
Every edge of the baffle re-radiates part of the sound. Crover computes the edges as secondary sources (after Vanderkooy, like VituixCAD and “The Edge”): below about 115/width the driver radiates into full space (−6 dB), above it into half space, in between with ripples whose position depends on where the driver sits. Radii and chamfers smooth them. The port is a source of its own with its own position and diffraction; a port on the back, side or bottom radiates into full space and arrives later, over the path around the cabinet.
Drag a driver or a port in the drawing and the response follows live. While dragging Crover uses fewer edge points (less than 1 dB difference), on release full resolution; the whole drag is one undo step. Not modelled: rear edges, cabinet depth, floor and room.
Listening axis and offsets
Under Listening axis (in Advanced with Show all settings) you set the distance (default 1 m) and the height from the top edge (default: the tweeter, i.e. the smallest driver on the baffle). From each driver's path to that point Crover proposes an acoustic offset – the path minus the shortest one. Accept sets it; nothing changes on its own. For a driver whose measured phase already contains the timing the offset has no effect, so the button is off there. The curves themselves stay on each driver's axis at 1 m, as in a datasheet.
The AI assistant and the enclosure
The assistant sees the active box with its chambers, the T/S and which curves are estimated. It can read T/S values out of pasted datasheet text and change them (in datasheet units), as well as a chamber's type and net volume (the depth follows as with your input), the length, diameter and number of ports, a passive radiator (datasheet values or the added mass for an fB), a driver's chamber and whether it sits in the partition (bandpass). It proposes these steps like any other change: you see each step with the new tuning (for example Port 1.1: length 120 → 150 mm → fB 38 Hz) and the before/after curve, and apply them as one step that Undo takes back.
How accurate is Crover?
The enclosure planner is an Alpha: it calculates with estimates from the T/S parameters and the geometry. What is checked and what isn't yet (as of October 2026):
Checked against published references
- Textbook tables: for every row of Leach's vented-box tables (losses QL 3 to ∞) Crover hits the lower cut-off to better than 0.001 %. Sealed-box resonance, tuning frequency and port length match the worked examples of Leach and Linkwitz to 0.1 %.
- Level at full excursion: within 0.2 dB of Linkwitz.
- Edge diffraction: against Olson's measurements of a cube and a box (1951) Crover hits the position and size of the ripple; the shape typically differs by 1 dB (rms), at most 2.5 dB (100 Hz–4 kHz).
- One real measurement: an MW16P-4 in a 17 l vented box – the near field from 125 to 400 Hz was within ±1.5 dB.
Not checked yet
- Curves against WinISD and VituixCAD: the comparison is prepared but has not run yet.
- Below 100 Hz against a measurement: no reliable number yet – the built test box was tuned lower than planned, and the measurement setup is not known precisely enough.
- Passive radiator and bandpass are only checked against formulas and table values from the literature, not yet against another program or a measurement.
The calculation is only as good as its inputs, though. T/S parameters often vary by 10 % and more from unit to unit and are usually measured cold and at small signal; whether the built box is tuned as planned only the impedance measurement shows. Above about c/(π·cone diameter) – around 900 Hz for a 6.5-inch driver – the piston approximation is uncertain and cone break-up is missing entirely; the chart names the limit. If something looks wrong, tell us – it helps a lot.
Limits
- Sealed, vented, passive radiator and bandpass (4th and 6th order, driver in the partition); no open baffle, transmission line or horn. A port from one chamber into the other (series-tuned bandpass) and vented chambers behind a driver are not there yet.
- Several drivers in one chamber are computed as driven alike. When the crossover filters them differently (2.5-way), Crover warns: the estimate is then inaccurate.
- Pipe resonances show as a key figure and a warning but are not in the response; the cabinet's rear edges, the room and the floor are not in the model.
- Variants cannot be overlaid in one chart yet.
9Network tools
Four tools calculate standard networks for one driver and insert them for you: crossover filter, notch, Zobel and L-pad. Open them from the Tools section of the palette (click or tap with a driver selected, or drag onto a driver) or from a driver's context menu (right-click or long-press) → Add network.
How the tools work
- Pick the driver (or click it on the canvas). The fields are pre-filled from its measurements – each field says where the value came from (from ZMA, from simulation, nominal, typical). After you type your own value, a link brings the suggestion back.
- Adjust. The graph shows the result as dashed curves while you type: the summed response, the driver, and the system impedance.
- Click Insert. The parts are placed and wired next to the driver in one step – undo removes them all again.
With Standard values (E24 R, E12 C/L) on (default), values are rounded to parts you can buy; the list shows how far each is from the calculated value and warns above 10 %.
Crossover filter
A high-pass or low-pass for the driver (guessed from the driver; change it if needed).
- 1st order (6 dB/oct): one series part – a capacitor for a high-pass, a coil for a low-pass.
- 2nd order (12 dB/oct): the series part plus a part across the driver. Q sets the shape at the corner: Linkwitz-Riley 0.5, Bessel 0.577, Butterworth 0.707, or your own value.
- Load impedance: the driver's |Z| at the crossover frequency from the ZMA, otherwise the nominal impedance.
Keep in mind that the formulas give an electrical filter into a resistor. The acoustic slope is filter plus driver – that is what the sum depends on.
Notch (trap)
A series L-C (and optionally R) circuit across the driver that pulls down a peak – typically a tweeter's resonance peak or a cone break-up. Inputs: centre frequency, Q (higher = narrower), the impedance at that frequency and a damping resistor (0 Ω = deepest notch). With a ZMA that shows a clear resonance, the tool pre-fills the classic resonance compensation from the driver's parameters.
A notch across the driver only works if there is a series part before it; the tool warns if the driver is fed straight from the amplifier. It switches the graph to impedance, so you can see the peak flatten.
Zobel
A resistor and capacitor in series across the driver that cancels the rising impedance of the voice coil, so a low-pass filter sees a nearly constant load. It uses R = Re and C = Le / Re², with Re and Le estimated from the ZMA (or from the nominal impedance without one).
L-pad
Two resistors that make a driver quieter while its load on the filter stays the same – usually for a tweeter that is more sensitive than the woofer. Set the attenuation in dB; the tool suggests how much louder the driver plays than the others (when all drivers have FRD data). R1 goes in series, R2 across the driver.
Calculators without a project
The same formulas are also available as free calculators to try without a project: crossover, 1st–4th order, baffle step and Zobel and L-pad. Every result opens as a new project – then load your drivers' FRD/ZMA files.
10Tune automaticallyBeta
Tune automatically suggests a crossover from your driver data – as a starting point, not a finished result. Your circuit changes only when you adopt a suggestion – one undo step, and on cloud projects your state before is kept as a version. Open it from the palette under Tools → Auto crossover; a large dialog walks you through four steps: Check, Drivers, Goal, Result. Automatic tuning needs a (free) account; as a guest the dialog offers Create account and Sign in – your project comes along.
1. Check
A list with three marks: ⛔ problem (solve it first, there is no way on otherwise), ⚠ attention (good to know) and ✓ (in place). Every line says what to do and has the matching button: Add amplifier, Load measurements … or Add chassis (datasheet, WinISD, by hand) for an empty project, Load data … for a driver without FRD or ZMA, an fs field and Load datasheet … when a tweeter's resonance is unknown or (for a horn) uncertain. Curves estimated from the enclosure are fine to start – tune again once you have measured. A driver that is not wired in while the others are is left out.
2. Drivers and 3. Goal
- Drivers – one card per driver: its role (if Crover's guess is wrong, pick it yourself), one sentence about what it does ("plays cleanly up to 1.2 kHz · baffle step ≈ 6 dB") and only what to watch out for – each with driver and frequency. All readings opens the full analysis, where a feature can be ignored.
- From three drivers on the step first asks How should the drivers work together? – 2-way (doubled woofers in parallel), 2.5-way or 3-way; the roles follow the choice. Automatic tuning can only design new 2-way crossovers so far: for 2.5 and 3-way, sketch the crossover in the editor and it fine-tunes it.
- Focus – four cards: Balanced, Linear first (a flatter sum), Phase first (the drivers stay closer in phase around the crossover) or Few parts.
- Parts – My parts list (parts you have, imported as CSV and kept in this browser only; only the list, or the list then E12), Standard values (E12 or E24, coils with realistic wire resistance) or Ideal values.
The target is a flat sum on axis; the impedance stays above the editor's warning threshold (usually about 3 Ω).
4. Result
Start tuning always searches thoroughly (usually under a minute). If your circuit already is a crossover, the same run does both: it improves your crossover (its topology stays, values move at most to double or half) and designs new ones from proven building blocks. Stop cancels without changing anything; Take this one now ends the search with the best so far.
On the left the list: first Your crossover, improved (or "Your crossover is already close to the optimum"), then the new suggestions. On the right the selected entry: the three key figures (deviation from flat, parts, lowest impedance), the graph Your crossover vs. suggestion (the suggestion dashed, as in the editor's variant comparison), the Schematic and the Please note list – ⛔ and ⚠ shown, the reasons under Why it is so. Compare puts your crossover and every suggestion side by side in a table. Adopt replaces your crossover with the suggestion (one undo step; on cloud projects the history keeps "Before: …" and "After: …"). Compare first closes the dialog and shows the suggestion dashed in the graph; the bar above the graph offers Adopt, Discard and Back to the suggestions. Suggestions you have not dealt with wait under Earlier suggestions in the Check step – compare, adopt or delete them there; Tune again starts with the same settings.
Honestly: what it can and cannot do
- New suggestions for 2-way crossovers only for now (one woofer and one tweeter branch). Your own crossover Crover fine-tunes in any topology: 3-way with a midrange, 2.5-way, series crossovers, drivers in series or in parallel, parts shared by several branches. Only values change, never the circuit. With more than two ways the run therefore fine-tunes only.
- Rated on axis only – dispersion, room and distortion are not part of it. A suggestion is a good starting point, not an "optimal" result. The guardrails (tweeter attenuation at its resonance, crossover for horns, lowest impedance) are hard for new suggestions; on your own crossover they are checked and reported.
- Same input, same result: tuning is deterministic. It runs on the Crover server; your measurements are used for the run only and not stored. Each account has about ten minutes of computing time a day (at most three runs in five minutes, one at a time); an unchanged input that was already tuned comes back at once and costs nothing.
11The assistant
The assistant is a chat that knows your circuit. It can read the simulation, try changes on a copy, run an optimiser and suggest edits – but it never changes your circuit without you clicking Apply.
Setting it up
Open it with the sparkle button in the header or ⌘⇧A / Ctrl+Shift+A. It lives as the Assistant tab next to Properties in the right-hand panel.
- You need your own API key from Anthropic, OpenAI or Mistral. An API key is not the same as a ChatGPT Plus or Claude subscription – you create it in the provider's developer console and pay per use there. Crover does not supply a key or a free quota. Never done this before? The step-by-step guide below explains it, including what it costs.
- In Settings → AI pick the provider, paste the key and choose a model. Crover tests the connection with one tiny request.
- Read and accept the privacy notice. It lists what is sent to the provider: Crover's instructions, the project name, the circuit, simulation results, your messages and the assistant's recent answers, the results of the tools it uses and – if the assistant searches the web – the search terms.
The key is stored encrypted in this browser. Requests go through the Crover server to the provider; the server neither stores nor logs the key, and conversations are not stored on the server. More in Your key and your data.
What it sees
With every message the assistant gets a fresh summary of the project:
- all parts with their values and a netlist (which terminal connects to what, each driver's branch)
- which drivers have FRD/ZMA data
- a digest of the simulation: level, crossover points with the phase difference there, the largest dips and peaks, impedance range and warnings
It works on the unsmoothed data, whatever smoothing you use for the graph. Dips and peaks below 150 Hz are left out of the digest on purpose – they usually come from the room or the measurement, not from the crossover. It does not see a picture of your screen, and it only reads a driver's measurement in detail when it asks for it.
What it can do
- Explain and check – read the circuit, find obvious problems (no ground, missing measurements, impedance below 3 Ω) and explain what the curves mean.
- Try changes on a copy – simulate a different value or a whole edit plan and show a before/after chart in the chat. Your circuit stays untouched.
- Run the optimiser – tunes existing part values (never the structure) for the flattest summed response in a band (150 Hz–15 kHz by default), optionally with target crossover frequencies, a target level, a minimum impedance and rounding to E12/E24 values. At most 12 parts per run, each within ¼× to 4× of its current value. If it finds nothing better, it says so.
- Create variants – a copy of the circuit with its suggestion applied, shown as a dashed curve in the graph so you can compare (see Variants).
- Suggest edits – change values, add or remove R/L/C parts, rewire terminals, set a driver's polarity or offset, rename parts. Drivers, the amplifier and ground cannot be removed or have their values changed by the assistant.
- Ask you questions with clickable answers, and search the web (e.g. for a datasheet).
- Draft a bug report for the Crover team – you check and send it yourself.
Every step it takes appears as a line above the answer (Read the simulation, Ran the optimiser, …). The quick actions on the empty chat (Analyze circuit, Optimize transition, …) are good starting points.
Approving changes
When the assistant wants to change your circuit, a dialog shows exactly what: old and new value, the parts and drivers affected, a before/after Response preview and its reasoning. Click Apply or Reject; closing the dialog counts as reject. There is no auto-approve.
An applied suggestion – even a whole plan – is one undo step. In the chat it leaves a line like Applied: C1: 6.8 → 4.7 µF; click it to select and highlight the parts on the canvas. The parts also glow briefly right after applying.
Thinking mode
Settings → AI → Think before answering lets the model reason before it answers. Worth it for harder tasks like designing or optimising a crossover; answers take longer and use more tokens of your key. The steps fold into one line such as 5 steps · Thought for 8 s, which you can expand. Claude Opus 5.5 always thinks: with it selected the switch stays on and cannot be turned off, and its thinking is shown too.
Good to know
- The conversation is stored in this browser only and is shared across your projects. The ↺ button (New conversation) starts over; its tooltip shows the tokens used.
- No file or image attachments – describe what you want in text.
- It replies in the language of your last message.
- It is a language model: check its reasoning against the curves. Its before/after charts are real simulations, its explanations are not guaranteed to be right.
Getting an API key, step by step
Never had a developer account? No problem – this takes about ten minutes and needs no programming. The assistant runs on a language model from Anthropic, OpenAI or Mistral. You open an account with one of them, load a few euros onto it and let Crover use it. There is no Crover subscription: you pay the provider directly for what you use, and you decide how much that may be.
Three words you will meet on the way:
- API key – a long password that lets a program (here: Crover) use your account at the provider. Whoever has it can spend your credit, so treat it like a password.
- Token – the unit the providers bill by, a piece of a word. 1,000 tokens are roughly 750 English words; prices are quoted per million tokens.
- Prepaid credits – money you load onto the account in advance. Usage is deducted from it; when it is used up, the assistant stops until you top up.
Which provider? If you have no preference, start with Anthropic and Claude Sonnet 5 – that is what Crover recommends. All three work the same way in Crover; the steps differ only on the provider's website. Their pages change often, so look for the labels below rather than exact positions.
Anthropic (Claude)
- Go to platform.claude.com (the Claude Console) and create an account with your e-mail address, or sign in.
- Buy credits: Settings → Billing, add a card and buy credits. Anthropic bills API use through prepaid credits; credits expire one year after purchase and are not refundable, so start small. New accounts may receive a small free amount to test with.
- Set a spend limit: on the same Billing page under Spend limits click Set limit (or Adjust limit) and enter a monthly maximum, e.g. 5 $. When it is reached, requests are refused until the next month or until you raise it.
- Create the key: Settings → API keys → Create key. Give it a name like “Crover”, pick an expiry and confirm.
- Copy the key right away. It starts with
sk-ant-(e.g.sk-ant-api03-) followed by a long row of letters and digits, and it is shown only once. If you lose it, delete it and create a new one. An admin key (sk-ant-admin…) does not work for the assistant.
Models in Crover: Claude Sonnet 5 (recommended – good answers at a moderate price), Claude Haiku 4.5 (half the price, fine for quick questions), Claude Opus 5.5 (the most thorough, 2× the price of Sonnet; it always thinks before answering, whatever the thinking switch says) and the older Claude Opus 5 (more expensive than Opus 5.5, kept for existing settings). Official help: Get your Claude API key.
OpenAI (GPT)
- Go to platform.openai.com and sign up or sign in. This is the developer platform, not chatgpt.com.
- Buy credits: Settings → Billing, add a payment method and buy credits. The minimum purchase is 5 $; credits expire after a year and are not refundable. Leave auto recharge off if you want a firm ceiling.
- Set a spend limit: Settings → Limits → Edit spend limit, enter a monthly amount and turn on Enforce a hard limit – without it the limit only sends you an e-mail and usage continues (OpenAI: spend limits).
- Create the key: API keys → Create new secret key, name it “Crover” and confirm.
- Copy the key right away. It starts with
sk-proj-(older keys withsk-) and is shown only once.
Models in Crover: GPT-6 Sol (recommended – the price of GPT-5.6 Terra with cheaper output), GPT-6 Luna (by far the cheapest, a twentieth of Sol), GPT-6 Astra (the top model, five times the price of Sol) and the older GPT-5.6 Terra and GPT-5.6 Luna, kept for existing settings. OpenAI may ask you to verify your organisation before some models or features work – if an error says so, follow the link in OpenAI's settings.
Mistral
- Go to console.mistral.ai and sign up or sign in.
- Choose how to pay. Mistral has a free mode without a card, with low limits – enough to try Crover. For regular use switch to pay-as-you-go in the billing settings and add a payment method (Mistral: limits and tiers).
- In the free mode your requests may be used to train Mistral's models unless you switch that off in the admin console under Privacy (Mistral help).
- Create the key: API Keys in the left sidebar → Create new key, name it “Crover”, pick an expiry and confirm.
- Copy the key right away – a long string of letters and digits without a prefix, shown only once (Mistral: generate an API key).
Models in Crover: Mistral Large (recommended – Mistral's flagship, and at 0.50 / 1.50 $ per million tokens cheaper than Medium), Mistral Medium and Mistral Small (the cheapest). We found no monthly spend limit you can set yourself in Mistral's documentation – keep an eye on the usage page in the console.
Pasting the key into Crover
- Open the Assistant tab (sparkle button in the header): as long as no key is set up, the setup is right there in the tab. The same fields are in the settings: the round account button at the top right → Settings → tab AI.
- Pick the provider whose key you have.
- Paste the key into the API key field. A green tick in the field means the format fits; a red cross means it does not (usually a missing piece or a space at the end).
- Choose a model – the recommended one is marked, and each shows its price per million tokens. Crover now tests the connection with one tiny request (a fraction of a cent). A green tick below the model means it works.
- The privacy notice appears (in the tab right below the fields, in the settings as a dialog). Read it and agree – that switches the assistant on. The Assistant tab now shows the chat instead of the setup. The thinking switch and deleting all AI data stay in the settings (More AI Settings… in the tab).
What it costs
Every message sends Crover's instructions, the tool descriptions and a summary of your circuit and its simulation along with your question. For the demo project that is about 35,000 characters, roughly 10,000–12,000 tokens – most of the cost is this context, not your question. When the assistant uses tools (reads the response, tries a change, runs the optimiser), each step is a new request that carries the context again plus the results so far.
With Anthropic, Crover asks for prompt caching: the context of a question is stored at the provider for five minutes, and every further tool step reads it at a tenth of the input price (a twentieth on Opus 5.5) instead of paying it in full again. Writing it the first time costs 1.25×, so a question with one request costs slightly more, one with tool steps about half. OpenAI does this on its own (cached input at a tenth of the price). Only the most recent part of a long conversation is sent (about 8,000 tokens of earlier messages); the chat keeps everything.
Prices of the models in Crover, in US dollars per million tokens (checked on 28 September 2026):
| Model | Input | Output |
|---|---|---|
| Claude Sonnet 5 (recommended) | 2 $ | 10 $ |
| Claude Haiku 4.5 | 1 $ | 5 $ |
| Claude Opus 5.5 | 4 $ | 20 $ |
| Claude Opus 5 | 5 $ | 25 $ |
| GPT-6 Sol (recommended) | 2 $ | 10 $ |
| GPT-6 Luna | 0.10 $ | 0.50 $ |
| GPT-6 Astra | 10 $ | 50 $ |
| GPT-5.6 Terra | 2 $ | 12 $ |
| GPT-5.6 Luna | 0.20 $ | 1.20 $ |
| Mistral Large 3 (recommended) | 0.50 $ | 1.50 $ |
| Mistral Medium 3.5 | 1.50 $ | 7.50 $ |
| Mistral Small 4 | 0.15 $ | 0.60 $ |
Sources: Anthropic, OpenAI, Mistral. Crover asks Mistral for the “latest” Large, Medium and Small; the versions above are the current ones on Mistral's price list. Prices change – the provider's page is what counts.
Estimated cost per question, without / with thinking mode, in US cents:
| Model | Simple question | With simulations | Optimiser run | 30 questions a month |
|---|---|---|---|---|
| Claude Sonnet 5 | 3.4 / 4.9 ¢ | 6.6 / 11 ¢ | 13 / 21 ¢ | 1.45 / 2.23 $ |
| Claude Haiku 4.5 | 1.7 / 2.4 ¢ | 3.3 / 5.3 ¢ | 6.4 / 10 ¢ | 0.73 / 1.12 $ |
| Claude Opus 5.5 | – / 9.7 ¢ | – / 20 ¢ | – / 40 ¢ | – / 4.36 $ |
| Claude Opus 5 | 8.4 / 12 ¢ | 17 / 27 ¢ | 32 / 52 ¢ | 3.64 / 5.59 $ |
| GPT-6 Sol | 2.8 / 4.3 ¢ | 5.9 / 9.9 ¢ | 12 / 20 ¢ | 1.27 / 2.05 $ |
| GPT-6 Luna | 0.1 / 0.2 ¢ | 0.3 / 0.5 ¢ | 0.6 / 1 ¢ | 0.06 / 0.10 $ |
| GPT-6 Astra | 14 / 22 ¢ | 29 / 49 ¢ | 59 / 99 ¢ | 6.33 / 10.23 $ |
| GPT-5.6 Terra | 2.9 / 4.7 ¢ | 6.3 / 11 ¢ | 13 / 23 ¢ | 1.35 / 2.28 $ |
| GPT-5.6 Luna | 0.3 / 0.5 ¢ | 0.6 / 1.1 ¢ | 1.3 / 2.3 ¢ | 0.13 / 0.23 $ |
| Mistral Large 3 | 0.6 / 0.9 ¢ | 3 / 3.6 ¢ | 5.9 / 7.1 ¢ | 0.49 / 0.61 $ |
| Mistral Medium 3.5 | 2.1 / 3.2 ¢ | 9.8 / 13 ¢ | 20 / 26 ¢ | 1.59 / 2.17 $ |
| Mistral Small 4 | 0.2 / 0.3 ¢ | 0.9 / 1.2 ¢ | 1.9 / 2.3 ¢ | 0.15 / 0.20 $ |
These are estimates, not quotes. Assumptions: a two-way project like the demo; about 11,000 input tokens per request; a simple question = 1 request and a 600-token answer; with simulations = 5 requests (four tool steps, e.g. read the response and try two changes, then the answer); an optimiser run = 9 requests. Thinking adds roughly 1,500 / 4,000 / 8,000 output tokens. 30 questions a month = 20 simple, 8 with simulations, 2 optimiser runs. Anthropic and OpenAI with caching as described above (each later step: the context read from the cache plus about 1,000 new tokens); Mistral without. Opus 5.5 always thinks, so it has no “without” value. A bigger circuit, a long conversation (up to about 8,000 tokens of earlier messages go along) or more tool steps cost more. In euros the amounts are about the same.
- Set a monthly spend limit at the provider – that is the only hard ceiling.
- Leave Think before answering off for simple questions; switch it on for design and optimising.
- Use a smaller model (Haiku, Luna, Small) for quick explanations.
- Start a new conversation (↺) when you change topic – the most recent earlier messages (up to about 8,000 tokens) go along with every message.
- The ↺ button's tooltip shows the tokens used in the current conversation; the provider's usage page shows the money.
Your key and your data
- Where the key is stored: only in this browser, encrypted (AES-GCM, with a device key that cannot be exported). It is not saved in your Crover account and does not travel to your other devices – on a new device or browser you paste it again.
- Who can see it: anyone who can use this browser profile can use the assistant with it. With every assistant request the key is sent to the Crover server, which passes it straight on to the provider. Crover's server code neither stores nor logs it (the server log records only the address and status of a request). The server passes requests on only for someone signed in to Crover – a guest session is enough – so it is no open relay for other people's keys.
- What goes to the provider: Crover's instructions, the project name, all parts with their values and connections, the simulation summary, your messages and the assistant's earlier answers in this conversation (the most recent ones, about 8,000 tokens), your answers to its questions, and the results of the tools it uses while it answers (e.g. a driver's measurement at third-octave points, simulated changes, optimiser and web search results). No screenshots and no files. Web searches go through the Crover server to the search service Tavily. The provider handles all this under its own privacy policy.
- Conversations are stored in this browser only, not on the Crover server – one per account, so someone else signing in on the same browser does not see yours (a guest's conversation moves along when the guest creates an account or signs in). If the browser refuses to store it (storage full), the chat says so; the conversation then lasts only until you reload.
- Removing it from Crover: the red button at the bottom of Settings → AI deletes the key, the conversation and the local encryption key from this browser. That does not switch the key off at the provider.
- Revoking or replacing a key: in the provider's API key list (links above) delete or disable the key, create a new one and paste it into Crover. Do this regularly or when a key has expired.
When it doesn't work
- Red cross in the key field: the key does not have the provider's format. Copy it again in full and check that the right provider is selected – a Mistral key in the OpenAI slot, for example, never fits. Spaces and line breaks from copying are removed automatically. If the key belongs to another provider, the field says which one.
- “Invalid API key” / connection failed: the key was deleted, has expired or was mistyped – or the provider refuses it. Create a new key and paste it again.
- No credit left (Anthropic: “credit balance is too low”, OpenAI: “exceeded your current quota”): top up at the provider. Spending limit reached (the limit you set yourself): raise it in the provider's console or wait until it resets. Crover names both.
- Rate limit: too many requests in a short time – new accounts start with low limits, Mistral's free mode especially. Wait a minute and try again. A long optimiser run with thinking makes many requests in a row. “Too many requests to Crover” is Crover's own limit (120 requests a minute per connection, to protect its relay) – your credit is fine, just wait a moment.
- Model not available: some models need a higher account level or (at OpenAI) a verified organisation. Pick another model in Settings → AI; the provider's error text usually says what is missing.
- Network error: check your internet connection; the assistant needs the Crover server to be reachable.
- “Your Crover session has ended”: the assistant works only while you are signed in to Crover (as a guest too). Reload the page or sign in again – the key and the conversation stay.
12Variants, history and sharing
With cloud sync on, Crover keeps a history of every change, lets you save versions and share a project with others – live, like a shared document.
Variants
A variant is a copy of your circuit with a suggestion applied, created by the assistant – for example the result of the optimiser. Your circuit stays as it is until you decide. Variants appear as a card under the answer and in the Variants list above the chat input.
- Compare draws the variant's summed response as a dashed curve next to yours.
- Adopt applies it to the project as one undo step. On cloud projects, the state before and the result are also saved as versions.
- Save as version keeps it in the history without applying it; As project opens it as a new project.
- The bin icon discards it.
Variants are kept in this browser only (up to 12 per project) and are not shared with others.
History and versions
The clock icon in the header opens the Project history. It shows every saved change – by everyone, on every device.
- Changes: grouped by person and time. Undo this change takes back just that one change; if the same parts were changed again later, Crover asks whether to keep those later edits. Back to here returns the whole project to that point.
- Versions: Crover saves the state at the start of each day you work on the project automatically. You can also save a named version (“before the new tweeter”) at any time and restore it later. Deleting a named version moves it to Recently Deleted below the list, which shows how many days are left: there you can restore it or delete it for good; after 30 days it is removed on its own. The daily versions cannot be deleted. Deleted projects follow the same rules and have their own Recently Deleted tab in the project list, see Recently deleted projects under Getting started → Projects.
- Per part: at the bottom of the properties panel, History lists the changes to the selected part; Use this value brings an old state back.
Going back is a new change itself – so ⌘Z undoes a restore. Single changes are kept for 90 days; daily and named versions are kept as long as the project exists (deleted ones for 30 more days).
Undo (⌘Z) is personal: it takes back your own steps on this device, never someone else's.
Sharing
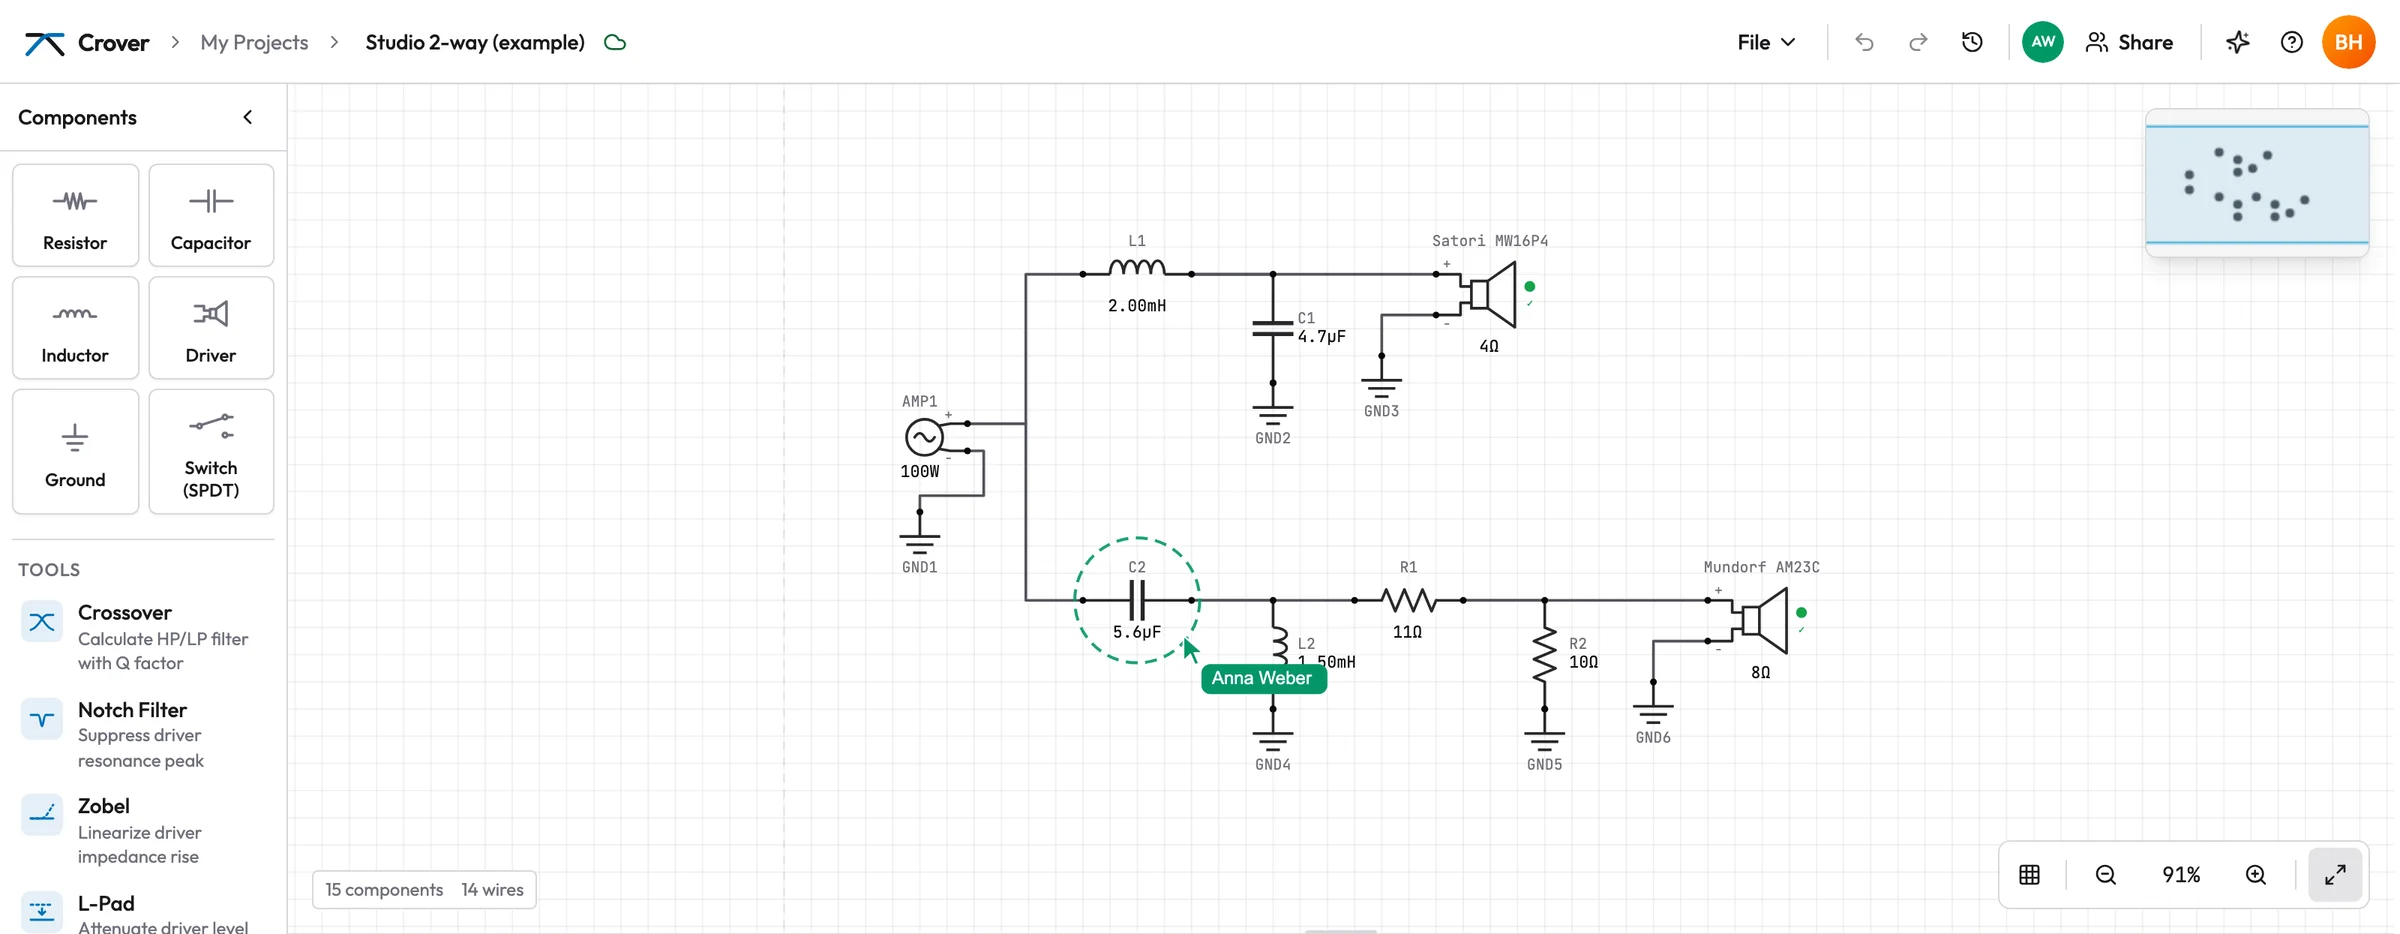
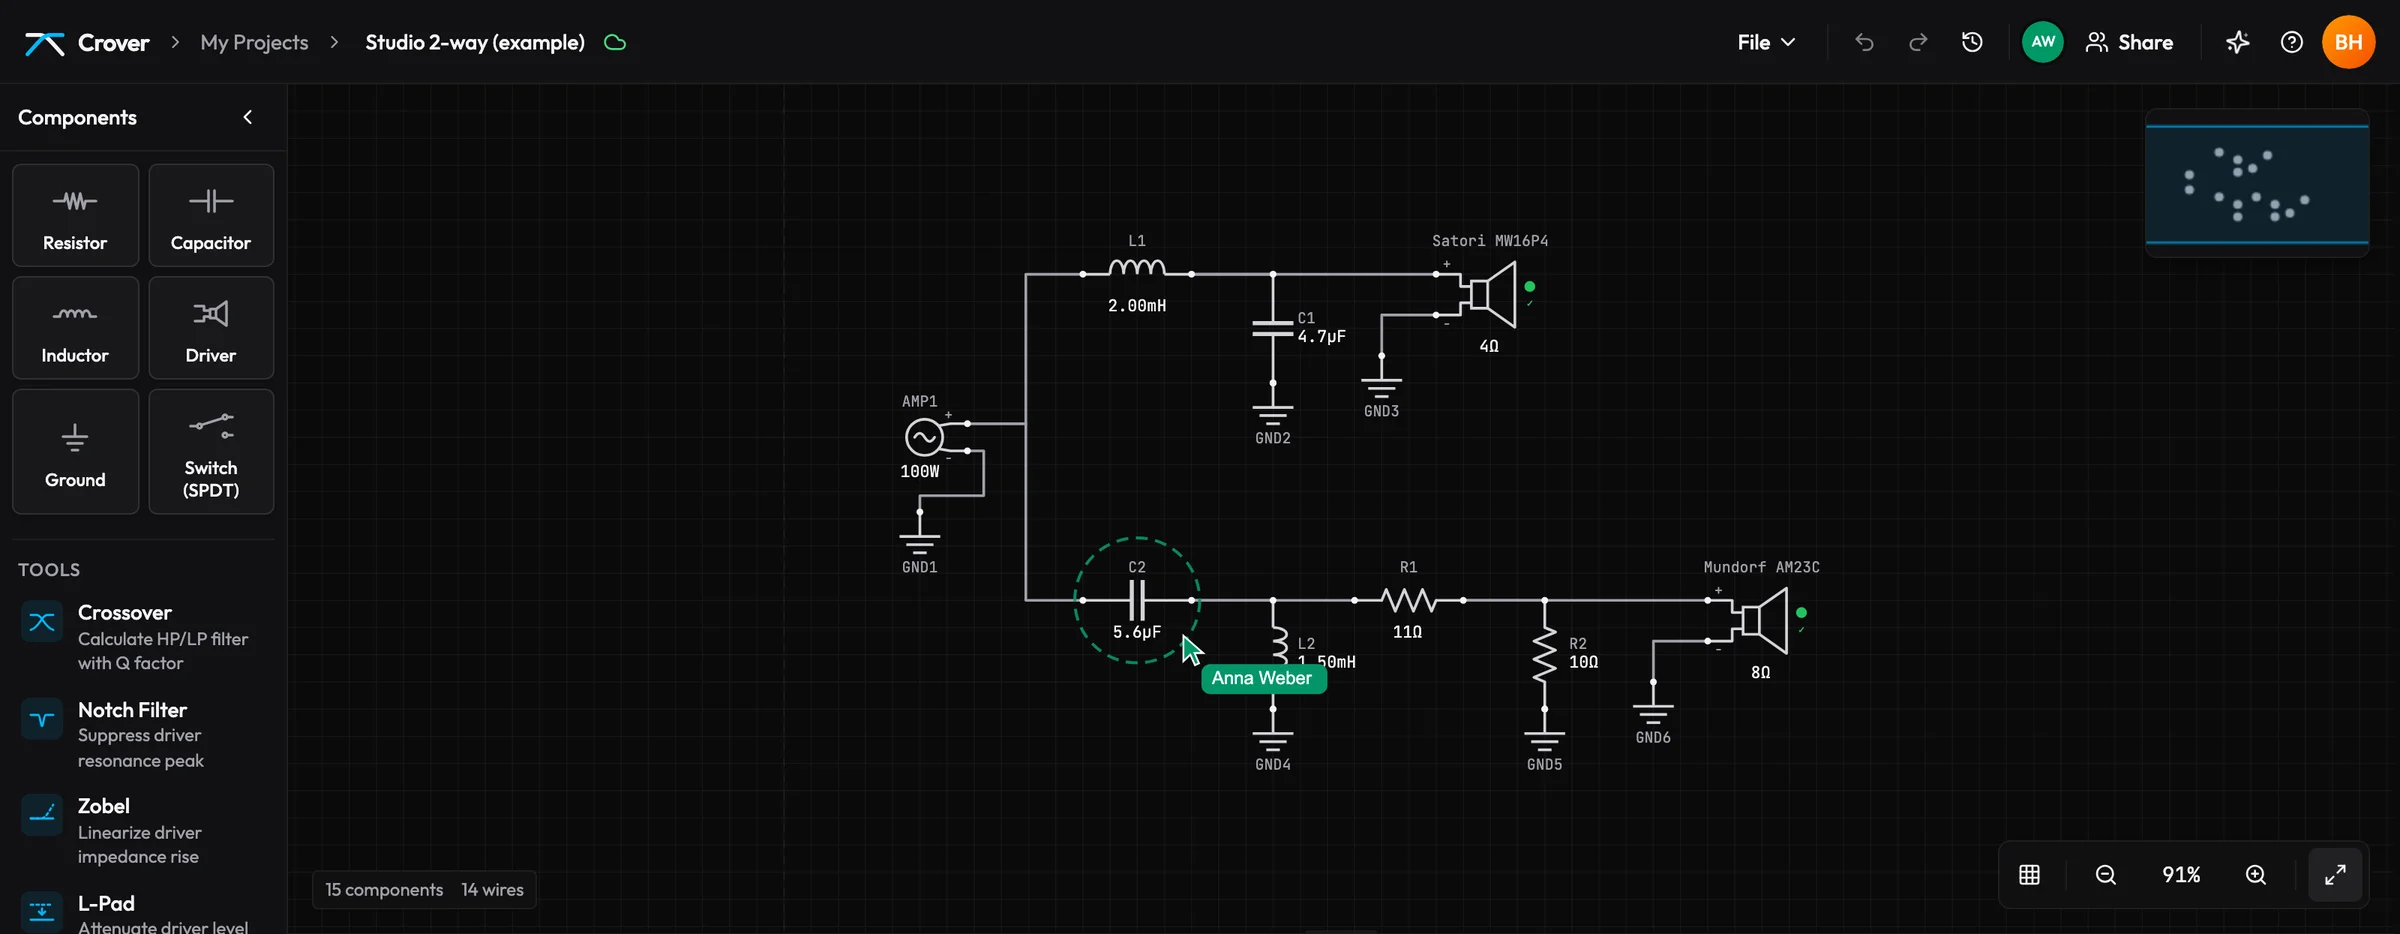
Share in the header (for account holders with cloud sync on) creates invite links:
- Can edit – the person can change everything, like you.
- Can view – the person can look around, but not change anything. A View only badge appears in their header.
Send the link any way you like. Whoever opens it needs a Crover account (not a guest session) and then joins the project. Links do not expire; Reset link makes the old one stop working and Turn off link disables it. In the people list you can change roles or remove someone; members can leave a project themselves.
Public page (project as post)
In Share, the owner can switch on Public page. The project then gets a link of its own (crover.app/p/…) that anyone can open without an account – ideal for a forum thread or a build report. The page shows the name, your chosen name (Shown as – never your email address), a description, build photos, the simulated curves (SPL, phase, impedance, group delay – interactive, but read-only), the schematic, the drivers and the parts list.
- A published version, not the live project. The page shows the state you published. Keep working as usual; when you are happy, Update public version replaces what visitors see. The dialog tells you when the project has changed since.
- Edit a copy: visitors get their own copy in the editor – as a guest right away, or in their account. The original stays untouched, and they get no access to your project.
- Photos: up to 8. They are scaled down in your browser and saved anew, and the server removes all metadata again – location (GPS), camera and date do not end up on the page.
- Link previews: forums and messengers show a preview picture with the project name and the summed response.
- Switching Public page off makes the project private again: the link stops working. Switching it on again brings the same link back. A project in Recently Deleted is never public.
Public pages are not listed anywhere and are hidden from search engines – only people with the link find them. Publishing needs an account (not a guest session).
Working together live
- Avatars in the header show who has the project open right now.
- Other people's pointers appear on the canvas with their name; their selection gets a coloured ring.
- Click an avatar to follow that person's view; Stop ends it.
- Changes appear for everyone immediately. If two people change the same part at the same moment, the change that reaches the server last wins.
13Feedback and messages
Found a bug, or missing something? Crover is built together with the people who use it – reports go straight to the developer.
Sending a report
Click the speech-bubble icon in the header (Report a bug or wish for a feature), or use the entry in the help panel. Choose Something's wrong or I have an idea, write one line and a few details.
- Attach the open project (on by default) sends the parts and values of the open project – no measurement curves. It makes bugs much easier to reproduce.
- Always included: the Crover version, your browser and the page you are on.
- Your name and email are not included in the report.
Guests can send reports too. The assistant can also draft a report for you – you check and send it.
Answers: the bell
The bell in the header collects your reports and the answers to them (Messages). A badge shows new answers or a status change – Open, Done, Not planned or Already reported.
- Reply answers a question from the team right there.
- Archive hides a conversation until something new arrives; the Archive list at the bottom brings it back with Restore.
If you created your account from a guest session, your earlier reports and their answers move with you.
14FAQ and troubleshooting
The SPL graph is empty
Crover only draws curves for drivers that actually play. Check:
- Is there a driver at all, and is it wired to the amplifier's plus terminal (through the filter)?
- Does the driver's minus terminal lead back – to a ground symbol or to the amplifier's minus? The warning Minus terminal not connected to ground says so.
- Is a part in the path set to open, or a switch on the other position?
- Look at the warnings in the canvas status bar – each one names the problem.
One driver has no curve, or a flat one
A missing curve means that driver is not in a closed loop with the amplifier (see above). A flat line marked flat · no FRD means the driver has no frequency response loaded – Crover then simulates a flat 70 dB response, which shows only the filter's electrical effect. Import the FRD.
The sum has a deep dip at the crossover
Almost always phase: the drivers are about 180° apart there. Try inverting one driver, then check the acoustic offset if the phase is derived. See the crossover dip trap.
The offset field is disabled, or the sum got worse after setting an offset
The field is disabled because the driver's phase is Measured: the timing is already in the data, and Crover ignores the offset so it is not counted twice.
If you switched a driver to Derived, Crover uses the minimum phase calculated from the SPL curve, which has no timing – the offset you enter is the only timing it gets. If the sum got worse, the offsets do not match your baffle yet, or only some drivers are derived. Either switch back to Measured, or – if your measurements really have no common timing reference – set all drivers to Derived and give each one its offset. See measured vs. derived.
The impedance looks wrong
- A flat line at 8 Ω (or 4 Ω) means the driver has no ZMA – it is simulated as a resistor. Load the ZMA.
- Values far too high or low: check that the FRD and ZMA were not swapped. The import dialog warns if an FRD looks like impedance data.
- A dip to almost 0 Ω: a part or a wire shorts the amplifier somewhere (Short circuit detected).
- Remember that the impedance view shows the whole speaker as the amplifier sees it, not one driver.
The level is much higher than my measurement
The amplifier's power sets the voltage. FRD files are usually measured at 2.83 V, which is 1 W into 8 Ω; the default of 100 W is 20 dB louder. Set the amplifier to 1 W to compare with your measurement directly.
My measurement file is not accepted or looks wrong
- Frequency must be in the first column, the level or impedance in the second, phase (optional) third.
- Decimal commas (
85,3, e.g. from a German locale) only work when the columns are not separated by commas as well – export with tabs or semicolons, or use decimal points.
My project is missing on another device
Check that cloud sync is on – on both devices – and that you are signed in with the same account. A guest session is tied to its browser; create an account to use your projects elsewhere.
“Not saved in this browser” appears
The browser refused to store the project: its disk is nearly full, or site storage is blocked (some private windows, strict privacy settings). Your work is still open – nothing is lost as long as the tab stays open. With cloud sync off, export it right away (File → Export as .crover), then free space or allow storage for the site. With sync on, the server keeps receiving your changes while you are online.
The assistant says my API key is invalid, or nothing happens
Check the key in Settings → AI – the connection test must succeed. An API key needs credit with the provider; a chat subscription (ChatGPT Plus, Claude Pro/Max) is not enough. Error messages from the provider are currently shown in German.
Can I import my XSim projects?
Yes – open the .dxo file with File → Open Project… or the import on the projects page. What comes over – parts incl. coil DCR and capacitor ESR, drivers incl. mute and level trim – is in Importing XSim projects.
Why does the estimated curve differ from my measurement?
The model agrees with the textbook equations, but it only knows what you entered. The usual causes, in order:
- T/S of a different unit. Datasheet values are typical values, measured cold; your driver may be 10 % or more off. Measure its free-air impedance and enter your own fs, Qes, Qms and Vas.
- The box is not tuned as planned. The minimum between the two impedance peaks of a vented box is its real fB. If it differs, check the port length and the net volume (damping, bracing and the driver take volume).
- Above a few hundred hertz the estimate is a rigid piston: no cone break-up, and the baffle is computed from the front only (no rear edges, no room). The chart names the frequency above which it gets uncertain.
- Different conditions. The estimate is 2.83 V, 1 m, half space. A room measurement, a different distance or a gated measurement without low end does not compare one to one.
Numbers from the reference comparison are in How accurate is Crover?.
Do I need T/S if I have measured?
For the crossover, no: a measured FRD/ZMA always wins over the estimate. T/S are still worth it for the planner – excursion, port air, max. SPL and the box proposal all come from them – and for filling in the low end of a gated in-box measurement below the splice (case c).
What does “bottleneck” mean?
The figure that gives up first when you turn up the level – the cone (past Xmax), the port (the air above 17 m/s) or the passive radiator (past its Xmax). The verdict at the top of the key figures says up to how many watts the box stays clean, and the row with the bottleneck mark is the reason. In Max. power you see it per frequency. See Understanding the key figures.
The box is planned, but the crossover still plays a flat line
In the driver's properties, Use curves from the enclosure is off – it is off for every new driver. Switch it on. If the section then says “Nothing estimated yet”, the reason follows: no T/S, or the chamber is incomplete (no volume, no port). See Curves from the enclosure.
The tuning changed although I did not touch fB
A port keeps its length when you change the box volume, so fB moves with it. Type the tuning you want under Tuning fB again; Crover works out the length. For the diameter (and the number of ports or slot sizes) Crover keeps fB itself; only when the volume is not enough for that does it move, and the port card says so.
Why does Crover warn below fB when the excursion fits?
Above the tuning the port holds the cone back; below it it does not, and the cone moves almost freely. The key figures show both: the peak above fB as the main value, the one below in small print. If the music has notes that low, a subsonic filter in front of the amplifier helps – Add a subsonic filter sets one at about 0.7 · fB. If it is not enough, the warning proposes a higher or steeper one. See Pre-filters.
Something unclear, missing or wrong in this manual? Tell us.